 Web Server Statistics for Cardin Studio Web Server Statistics for Cardin Studio
(Go To: Top: General Summary: Weekly Report: Daily Report: Daily Summary: Hourly Report: Hour of the Week Summary: Hourly Summary: Domain Report: Organization Report: Host Report: Host Redirection Report: Host Failure Report: Redirected Referrer Report: Failed Referrer Report: Referrer Report: Referring Site Report: Browser Report: Browser Summary: Operating System Report: Status Code Report: File Size Report: File Type Report: Directory Report: Redirection Report: Failure Report: Request Report)
This report contains overall statistics.
(Figures in parentheses refer to the 7-day period ending May 19
2026 at 2:00 AM).
Successful requests: 4,683 (1,465)
Average successful requests per day: 259 (209)
Successful requests for pages: 4,486 (1,417)
Average successful requests for pages per day: 248 (202)
Failed requests: 12,488 (4,691)
Redirected requests: 27 (11)
Distinct files requested: 1,115 (200)
Distinct hosts served: 1,287 (581)
Data transferred: 201.292 megabytes (46.380 megabytes)
Average data transferred per day: 11.145 megabytes (6.625 megabytes)
(Go To: Top: General Summary: Weekly Report: Daily Report: Daily Summary: Hourly Report: Hour of the Week Summary: Hourly Summary: Domain Report: Organization Report: Host Report: Host Redirection Report: Host Failure Report: Redirected Referrer Report: Failed Referrer Report: Referrer Report: Referring Site Report: Browser Report: Browser Summary: Operating System Report: Status Code Report: File Size Report: File Type Report: Directory Report: Redirection Report: Failure Report: Request Report)
This report lists the activity in each week.
Each unit ( ) represents 3 megabytes
or part thereof.
) represents 3 megabytes
or part thereof.
week beg.: #reqs: Mbytes: %bytes: ---------: -----: -------: ------: Apr/26/26: 240: 30.883: 15.34%:Busiest week: week beginning May/ 3/26 (85.834 megabytes).May/17/26: 283: 6.583: 3.27%:
(Go To: Top: General Summary: Weekly Report: Daily Report: Daily Summary: Hourly Report: Hour of the Week Summary: Hourly Summary: Domain Report: Organization Report: Host Report: Host Redirection Report: Host Failure Report: Redirected Referrer Report: Failed Referrer Report: Referrer Report: Referring Site Report: Browser Report: Browser Summary: Operating System Report: Status Code Report: File Size Report: File Type Report: Directory Report: Redirection Report: Failure Report: Request Report)
This report lists the activity in each day.
Each unit () represents 2.5 megabytes
or part thereof.
date: #reqs: Mbytes: %bytes: ---------: -----: -------: ------: May/ 1/26: 85: 0.055: 0.03%:Busiest day: May/ 5/26 (60.590 megabytes).May/16/26: 125: 20.300: 10.09%:
(Go To: Top: General Summary: Weekly Report: Daily Report: Daily Summary: Hourly Report: Hour of the Week Summary: Hourly Summary: Domain Report: Organization Report: Host Report: Host Redirection Report: Host Failure Report: Redirected Referrer Report: Failed Referrer Report: Referrer Report: Referring Site Report: Browser Report: Browser Summary: Operating System Report: Status Code Report: File Size Report: File Type Report: Directory Report: Redirection Report: Failure Report: Request Report)
This report lists the total activity for each day of the week, summed over all the weeks in the report.
Each unit () represents 2 megabytes
or part thereof.
day: #reqs: Mbytes: %bytes: ---: -----: -------: ------: Sun: 646: 38.353: 19.05%:Sat: 392: 53.549: 26.60%:
(Go To: Top: General Summary: Weekly Report: Daily Report: Daily Summary: Hourly Report: Hour of the Week Summary: Hourly Summary: Domain Report: Organization Report: Host Report: Host Redirection Report: Host Failure Report: Redirected Referrer Report: Failed Referrer Report: Referrer Report: Referring Site Report: Browser Report: Browser Summary: Operating System Report: Status Code Report: File Size Report: File Type Report: Directory Report: Redirection Report: Failure Report: Request Report)
This report lists the activity in each hour.
Each unit () represents 1 megabytes
or part thereof.
date time: #reqs: Mbytes: %bytes: ---------------------------: -----: -------: ------: May/12/26 2:00 AM- 3:00 AM: 12: 0.007: :Busiest hour: May/ 5/26 1:00 PM- 2:00 PM (29.937 megabytes).
(Go To: Top: General Summary: Weekly Report: Daily Report: Daily Summary: Hourly Report: Hour of the Week Summary: Hourly Summary: Domain Report: Organization Report: Host Report: Host Redirection Report: Host Failure Report: Redirected Referrer Report: Failed Referrer Report: Referrer Report: Referring Site Report: Browser Report: Browser Summary: Operating System Report: Status Code Report: File Size Report: File Type Report: Directory Report: Redirection Report: Failure Report: Request Report)
This report lists the total activity for each hour of the week, summed over all the weeks in the report.
Each unit () represents 20 requests
for pages or part thereof.
hour: #reqs: #pages: ---------------------: -----: ------: Sun 12:00 AM- 1:00 AM: 29: 28:
(Go To: Top: General Summary: Weekly Report: Daily Report: Daily Summary: Hourly Report: Hour of the Week Summary: Hourly Summary: Domain Report: Organization Report: Host Report: Host Redirection Report: Host Failure Report: Redirected Referrer Report: Failed Referrer Report: Referrer Report: Referring Site Report: Browser Report: Browser Summary: Operating System Report: Status Code Report: File Size Report: File Type Report: Directory Report: Redirection Report: Failure Report: Request Report)
This report lists the total activity for each hour of the day, summed over all the days in the report.
Each unit () represents 2 megabytes
or part thereof.
hour: #reqs: Mbytes: %bytes: ----: -----: -------: ------: 0: 207: 5.165: 2.57%:
(Go To: Top: General Summary: Weekly Report: Daily Report: Daily Summary: Hourly Report: Hour of the Week Summary: Hourly Summary: Domain Report: Organization Report: Host Report: Host Redirection Report: Host Failure Report: Redirected Referrer Report: Failed Referrer Report: Referrer Report: Referring Site Report: Browser Report: Browser Summary: Operating System Report: Status Code Report: File Size Report: File Type Report: Directory Report: Redirection Report: Failure Report: Request Report)
This report lists the countries of the computers which requested files.
Listing domains, sorted by the amount of traffic.
#reqs:  Mbytes: %bytes: domain
-----: -------: ------: ------
 4683: 201.292:   100%: [unresolved numerical addresses]
(Go To: Top: General Summary: Weekly Report: Daily Report: Daily Summary: Hourly Report: Hour of the Week Summary: Hourly Summary: Domain Report: Organization Report: Host Report: Host Redirection Report: Host Failure Report: Redirected Referrer Report: Failed Referrer Report: Referrer Report: Referring Site Report: Browser Report: Browser Summary: Operating System Report: Status Code Report: File Size Report: File Type Report: Directory Report: Redirection Report: Failure Report: Request Report)
This report lists the organizations of the computers which requested files.
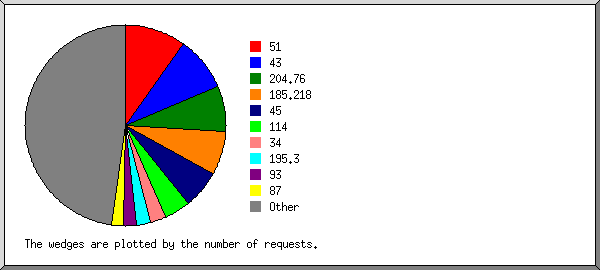
Listing the top 20 organizations by the number of requests, sorted by the number of requests.
#reqs: %bytes: organization
-----: ------: ------------
  996:  5.13%: 51
  305:  0.14%: 43
  239:  0.46%: 151.196
  238:  1.43%: 54
  229:  0.40%: 135.181
  197:  0.54%: 81.167
  189:  1.44%: 147.135
  163:  0.03%: 45
  146:  1.90%: 217.182
  143:  2.52%: 61.238
  122: 71.58%: 114
   82:  0.02%: 34
   70:  1.26%: 95
   68:  0.01%: 204.76
   61:  0.61%: 74
   56:  0.15%: 65.108
   54:  0.01%: 176.65
   47:  0.57%: 79
   41:  1.10%: 158.51
   38:  0.01%: 3
 1199: 10.68%: [not listed: 281 organizations]
(Go To: Top: General Summary: Weekly Report: Daily Report: Daily Summary: Hourly Report: Hour of the Week Summary: Hourly Summary: Domain Report: Organization Report: Host Report: Host Redirection Report: Host Failure Report: Redirected Referrer Report: Failed Referrer Report: Referrer Report: Referring Site Report: Browser Report: Browser Summary: Operating System Report: Status Code Report: File Size Report: File Type Report: Directory Report: Redirection Report: Failure Report: Request Report)
This report lists the computers which requested files.
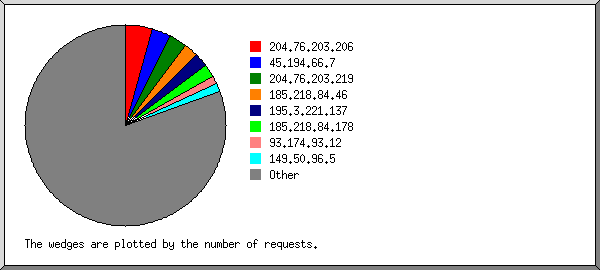
Listing the top 100 hosts by the number of requests, sorted by the number of requests.
#reqs:  Mbytes: %bytes: host
-----: -------: ------: ----
  480:   1.966:  0.98%: 51.77.43.72
  239:   0.925:  0.46%: 151.196.18.82
  217:   0.801:  0.40%: 135.181.180.59
  202:   0.683:  0.34%: 51.77.216.62
  197:   1.093:  0.54%: 81.167.26.57
  143:   5.071:  2.52%: 61.238.27.209
  138:   3.816:  1.90%: 217.182.194.3
  111:   0.447:  0.22%: 54.37.252.46
  105:   0.442:  0.22%: 147.135.213.175
  105:   0.441:  0.22%: 51.77.216.124
  104:   0.410:  0.20%: 51.83.7.81
   98:   0.042:  0.02%: 45.148.10.67
   68:   0.221:  0.11%: 54.37.84.47
   67:   0.028:  0.01%: 204.76.203.206
   56:   0.360:  0.18%: 95.91.110.210
   56:   1.228:  0.61%: 74.7.227.44
   47:   0.130:  0.06%: 65.108.2.171
   47:   0.245:  0.12%: 147.135.252.145
   41:   2.219:  1.10%: 158.51.80.246
   29:   1.122:  0.56%: 79.137.64.41
   27:   0.011:  0.01%: 93.174.93.12
   27:   0.242:  0.12%: 51.83.7.88
   26:   0.077:  0.04%: 51.68.233.43
   19:   0.135:  0.07%: 114.119.133.63
   19:  43.408: 21.56%: 114.119.129.199
   17:   0.007:       : 79.124.40.174
   17:   0.091:  0.05%: 114.119.153.56
   17:   0.007:       : 176.65.139.66
   15:   0.034:  0.02%: 37.27.51.142
   15:  29.976: 14.89%: 114.119.144.7
   14:   0.055:  0.03%: 114.119.136.174
   13:   0.033:  0.02%: 216.73.216.45
   13:   0.005:       : 176.65.139.254
   13:   0.005:       : 193.176.31.210
   13:  29.073: 14.44%: 114.119.155.111
   12:   0.009:       : 147.135.212.151
   12:   0.009:       : 135.181.213.219
   12:   0.009:       : 147.135.213.153
   12:   0.005:       : 193.176.31.147
   12:   2.115:  1.05%: 212.227.21.19
   12:   0.009:       : 54.37.254.160
   11:  27.639: 13.73%: 114.119.159.16
   10:   0.040:  0.02%: 185.208.206.98
   10:  13.698:  6.81%: 114.119.162.58
   10:   0.000:       : 20.106.250.49
    9:   0.003:       : 87.121.84.8
    9:   0.003:       : 217.216.66.74
    8:   0.162:  0.08%: 65.108.78.33
    8:   8.524:  4.23%: 145.239.195.38
    8:   2.136:  1.06%: 95.217.109.26
    8:   0.003:       : 45.135.193.156
    8:   3.673:  1.83%: 62.84.185.55
    8:   0.001:       : 213.209.159.223
    8:   0.003:       : 45.205.1.80
    7:   0.003:       : 176.65.139.156
    7:   0.003:       : 185.223.235.29
    6:   0.004:       : 145.239.69.106
    6:   0.004:       : 217.182.195.179
    6:   0.002:       : 3.131.220.121
    6:   0.002:       : 3.134.216.108
    6:   0.004:       : 147.135.212.200
    6:   0.002:       : 3.151.241.153
    6:   0.004:       : 42.200.231.39
    6:   0.004:       : 62.84.185.63
    6:   0.002:       : 52.13.219.52
    6:   0.004:       : 51.77.217.11
    6:   0.004:       : 54.37.252.231
    6:   0.004:       : 146.19.215.244
    6:   0.004:       : 159.112.133.109
    6:   0.002:       : 176.65.149.35
    5:   0.002:       : 43.157.46.118
    5:   0.001:       : 202.98.62.60
    5:   0.001:       : 66.249.68.38
    5:   0.002:       : 45.135.193.157
    5:   0.002:       : 43.132.214.228
    5:   0.002:       : 216.180.246.233
    4:   0.001:       : 103.77.246.173
    4:   0.004:       : 101.33.81.73
    4:   0.001:       : 43.164.1.211
    4:   0.001:       : 142.93.175.83
    4:   0.001:       : 49.51.73.183
    4:   0.026:  0.01%: 147.135.212.201
    4:   0.001:       : 103.203.57.3
    4:   0.001:       : 34.74.242.206
    4:   0.001:       : 101.36.111.179
    4:   0.001:       : 18.116.101.220
    4:   0.079:  0.04%: 54.37.252.119
    4:   0.000:       : 34.252.183.101
    4:   0.001:       : 80.96.109.204
    4:   0.001:       : 216.180.246.77
    4:   0.001:       : 45.142.154.115
    4:   0.001:       : 176.65.148.205
    4:   0.001:       : 152.32.189.137
    4:   0.001:       : 51.68.111.208
    4:   0.001:       : 185.223.235.18
    4:   0.001:       : 134.209.252.208
    4:   0.001:       : 5.61.209.102
    4:   0.001:       : 18.218.118.203
    3:   0.001:       : 172.236.119.165
    3:   0.001:       : 45.156.129.137
 1459:  18.153:  9.02%: [not listed: 1,187 hosts]
(Go To: Top: General Summary: Weekly Report: Daily Report: Daily Summary: Hourly Report: Hour of the Week Summary: Hourly Summary: Domain Report: Organization Report: Host Report: Host Redirection Report: Host Failure Report: Redirected Referrer Report: Failed Referrer Report: Referrer Report: Referring Site Report: Browser Report: Browser Summary: Operating System Report: Status Code Report: File Size Report: File Type Report: Directory Report: Redirection Report: Failure Report: Request Report)
This report lists the computers which were redirected to another file.
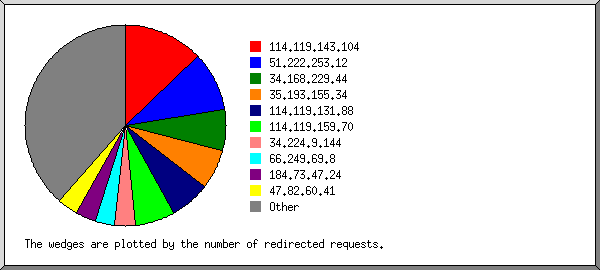
Listing hosts, sorted by the number of redirected requests.
#reqs: host
-----: ----
    5: 114.119.155.111
    5: 114.119.129.199
    4: 114.119.133.63
    2: 114.119.162.58
    2: 114.119.153.56
    1: 74.7.243.212
    1: 85.208.96.206
    1: 52.200.142.199
    1: 43.159.128.247
    1: 114.119.159.16
    1: 216.73.216.45
    1: 114.119.136.174
    1: 114.119.144.7
    1: 37.27.51.142
(Go To: Top: General Summary: Weekly Report: Daily Report: Daily Summary: Hourly Report: Hour of the Week Summary: Hourly Summary: Domain Report: Organization Report: Host Report: Host Redirection Report: Host Failure Report: Redirected Referrer Report: Failed Referrer Report: Referrer Report: Referring Site Report: Browser Report: Browser Summary: Operating System Report: Status Code Report: File Size Report: File Type Report: Directory Report: Redirection Report: Failure Report: Request Report)
This report lists the computers which encountered failed requests.
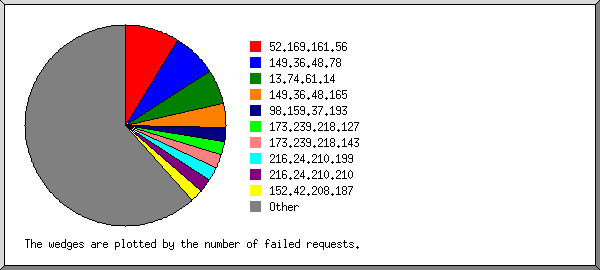
Listing the top 20 hosts by the number of failed requests, sorted by the number of failed requests.
#reqs: host
-----: ----
 2999: 185.177.72.100
 1108: 20.106.250.49
  317: 20.9.31.235
  270: 45.135.193.157
  231: 3.81.115.206
  230: 54.91.225.59
  227: 54.80.215.48
  206: 45.135.193.156
  194: 20.29.119.89
  180: 192.253.248.169
  160: 45.148.10.5
  155: 172.173.121.85
  153: 172.104.134.204
  152: 172.212.180.108
  152: 52.242.216.199
  140: 80.96.109.204
  125: 20.104.81.205
  120: 213.209.159.175
  117: 20.104.97.84
  106: 20.226.81.217
 5146: [not listed: 961 hosts]
(Go To: Top: General Summary: Weekly Report: Daily Report: Daily Summary: Hourly Report: Hour of the Week Summary: Hourly Summary: Domain Report: Organization Report: Host Report: Host Redirection Report: Host Failure Report: Redirected Referrer Report: Failed Referrer Report: Referrer Report: Referring Site Report: Browser Report: Browser Summary: Operating System Report: Status Code Report: File Size Report: File Type Report: Directory Report: Redirection Report: Failure Report: Request Report)
This report lists the referrers that caused redirected requests.
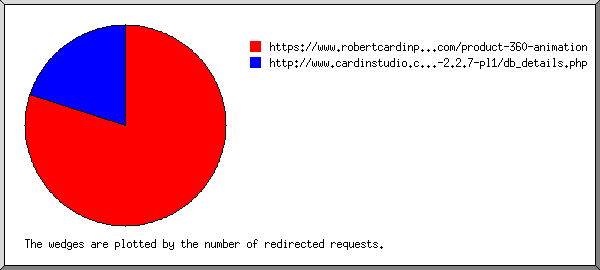
Listing referring URLs, sorted by the number of redirected requests.
#reqs: URL
-----: ---
    2: https://www.robertcardinphotography.com/product-360-animation
    1: https://www.robertcardinphotography.com
    1: http://www.cardinstudio.com/clients/142tenthst
    1: http://www.cardinstudio.com/phpMyAdmin-2.2.7-pl1/db_details.php
    1: http://www.cardinstudio.com/clients/142tenthstx2
    1: http://www.cardinstudio.com/nexus360
    1: http://www.cardinstudio.com/clients/142tenthstx3
(Go To: Top: General Summary: Weekly Report: Daily Report: Daily Summary: Hourly Report: Hour of the Week Summary: Hourly Summary: Domain Report: Organization Report: Host Report: Host Redirection Report: Host Failure Report: Redirected Referrer Report: Failed Referrer Report: Referrer Report: Referring Site Report: Browser Report: Browser Summary: Operating System Report: Status Code Report: File Size Report: File Type Report: Directory Report: Redirection Report: Failure Report: Request Report)
This report lists the referrers containing broken links to the site.
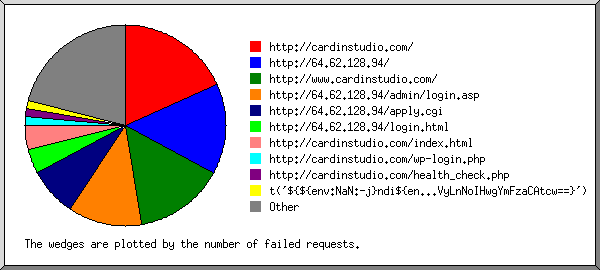
Listing referring URLs, sorted by the number of failed requests.
#reqs: URL
-----: ---
  136: https://www.google.com/
  134: https://duckduckgo.com/
  126: https://search.yahoo.com/
  124: https://www.google.com/search
  124:   https://www.google.com/search?q=
  121: https://www.bing.com/search
   29: http://64.62.128.94/
   20: http://cardinstudio.com/
   15: http://64.62.128.94/admin/login.asp
   13: http://www.cardinstudio.com/
    2: http://cardinstudio.com/index.html
    2: http://cardinstudio.com/site05/detecting_flash.html
    2: http://mail.cardinstudio.com/
    1: http://cardinstudio.com/noticias/up.php
    1: http://cardinstudio.com/noticias/mini.php
    1: http://cardinstudio.com/trx.php
    1: http://cardinstudio.com/qwer.php
    1: http://ftp.cardinstudio.com/
    1: http://cardinstudio.com/admin.php
    1: http://cardinstudio.com/files1bac.php
    1: http://www.cardinstudio.com/albert360animated/data/js/jquery-1.4.4.min.js
    1: http://www.cardinstudio.com/robots.txt
    1: http://cardinstudio.com/edit.php
    1: http://cardinstudio.com/mi.php
    1: http://cardinstudio.com/my.php
    1: http://cardinstudio.com/indexcard.php
    1: http://cardinstudio.com/arquivos/b374k.php
    1: http://www.cardinstudio.com/albert360animated/
    1: http://cardinstudio.com/motu.php
(Go To: Top: General Summary: Weekly Report: Daily Report: Daily Summary: Hourly Report: Hour of the Week Summary: Hourly Summary: Domain Report: Organization Report: Host Report: Host Redirection Report: Host Failure Report: Redirected Referrer Report: Failed Referrer Report: Referrer Report: Referring Site Report: Browser Report: Browser Summary: Operating System Report: Status Code Report: File Size Report: File Type Report: Directory Report: Redirection Report: Failure Report: Request Report)
This report lists the referrers (where people followed links from, or pages which included this site's images).
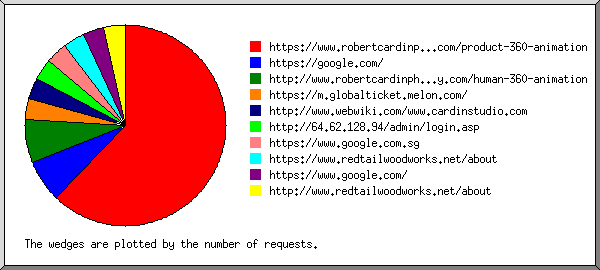
Listing referring URLs, sorted by the number of requests.
#reqs: URL
-----: ---
   12: https://www.robertcardinphotography.com
    7: http://64.62.128.94/cgi-bin/index2.asp
    4: https://robert-cardin-ykgu.squarespace.com/product-360-animation/
    3: https://www.google.com
    3: https://search.yahoo.com/
    2: https://www.robertcardinphotography.com/product-360-animation
    1: b'http://cardinstudio.com/'
    1: http://64.62.128.94/admin/login.asp
    1: https://www.google.com/search
    1: https://www.redtailwoodworks.net
    1: https://duckduckgo.com/
    1: http://www.redtailwoodworks.net/
(Go To: Top: General Summary: Weekly Report: Daily Report: Daily Summary: Hourly Report: Hour of the Week Summary: Hourly Summary: Domain Report: Organization Report: Host Report: Host Redirection Report: Host Failure Report: Redirected Referrer Report: Failed Referrer Report: Referrer Report: Referring Site Report: Browser Report: Browser Summary: Operating System Report: Status Code Report: File Size Report: File Type Report: Directory Report: Redirection Report: Failure Report: Request Report)
This report lists which servers people followed links from.
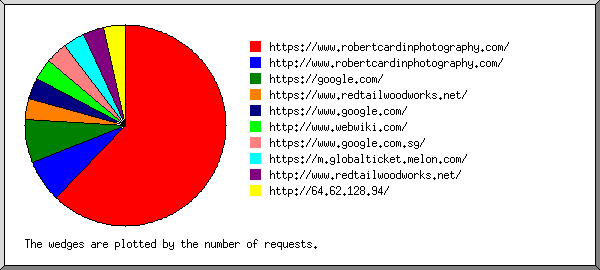
Listing referring sites, sorted by the number of requests.
#reqs: site
-----: ----
   14: https://www.robertcardinphotography.com/
    8: http://64.62.128.94/
    4: https://www.google.com/
    4: https://robert-cardin-ykgu.squarespace.com/
    3: https://search.yahoo.com/
    1: http://www.redtailwoodworks.net/
    1: https://www.redtailwoodworks.net/
    1: b'http://cardinstudio.com/
    1: https://duckduckgo.com/
(Go To: Top: General Summary: Weekly Report: Daily Report: Daily Summary: Hourly Report: Hour of the Week Summary: Hourly Summary: Domain Report: Organization Report: Host Report: Host Redirection Report: Host Failure Report: Redirected Referrer Report: Failed Referrer Report: Referrer Report: Referring Site Report: Browser Report: Browser Summary: Operating System Report: Status Code Report: File Size Report: File Type Report: Directory Report: Redirection Report: Failure Report: Request Report)
This report lists the browsers used by visitors.
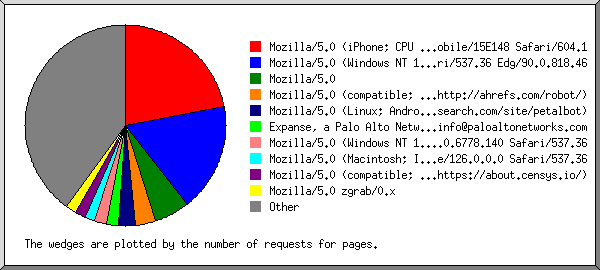
Listing the top 40 browsers by the number of requests for pages, sorted by the number of requests for pages.
#reqs: #pages: browser
-----: ------: -------
 2533:   2487: Mozilla/5.0 (compatible; MJ12bot/v1.4.8; http://mj12bot.com/)
  400:    400: Mozilla/5.0 (iPhone; CPU iPhone OS 13_2_3 like Mac OS X) AppleWebKit/605.1.15 (KHTML, like Gecko) Version/13.0.3 Mobile/15E148 Safari/604.1
  112:    112: Mozilla/5.0 (compatible; Infrawatch/1.0; +https://infrawat.ch/)
  103:    103: Mozilla/5.0 (Windows NT 10.0; Win64; x64) AppleWebKit/537.36 (KHTML, like Gecko) Chrome/131.0.0.0 Safari/537.36
   95:     95: Mozilla/5.0
   51:     51: Go-http-client/1.1
   74:     50: Mozilla/5.0 (Linux; Android 7.0;) AppleWebKit/537.36 (HTML, like Gecko) Mobile Safari/537.36 (compatible; PetalBot;+https://webmaster.petalsearch.com/site/petalbot)
   48:     48: Hello from Palo Alto Networks, find out more about our scans in https://docs-cortex.paloaltonetworks.com/r/1/Cortex-Xpanse/Scanning-activity
   41:     41: Mozilla/5.0 zgrab/0.x
   37:     37: Shodan-Pull/1.0
   34:     34: visionheight.com/scan Mozilla/5.0 (Macintosh; Intel Mac OS X 10_15_7) Chrome/126.0.0.0 Safari/537.36
   31:     31: Mozilla/5.0 (compatible; CensysInspect/1.1; +https://about.censys.io/)
   44:     27: Mozilla/5.0 (Linux; Android 7.0;) AppleWebKit/537.36 (KHTML, like Gecko) Mobile Safari/537.36 (compatible; PetalBot;+https://webmaster.petalsearch.com/site/petalbot)
   42:     26: Mozilla/5.0 (compatible; AhrefsBot/7.0; +http://ahrefs.com/robot/)
   25:     25: Mozilla/5.0 (compatible; MJ12bot/v2.0.5; http://mj12bot.com/)
   23:     23: Mozilla/5.0 (Windows NT 10.0; Win64; x64) AppleWebKit/537.36 (KHTML, like Gecko) Chrome/78.0.3904.108 Safari/537.36
   22:     22: Mozilla/5.0 (Macintosh; Intel Mac OS X 13_1) AppleWebKit/537.36 (KHTML, like Gecko) Chrome/108.0.0.0 Safari/537.36
   21:     21: Mozilla/5.0 (Macintosh; Intel Mac OS X 10_15_7) AppleWebKit/605.1.15 (KHTML, like Gecko) Version/17.4 Safari/605.1.15 (Applebot/0.1; +http://www.apple.com/go/applebot)
   21:     21: curl/7.74.0
   21:     21: curl/7.64.1
   20:     20: Mozilla/5.0 AppleWebKit/537.36 (KHTML, like Gecko; compatible; Amazonbot/0.1; +https://developer.amazon.com/support/amazonbot) Chrome/119.0.6045.214 Safari/537.36
   20:     20: python-requests/2.32.5
   20:     20: Mozilla/5.0 (Windows NT 10.0; Win64; x64) AppleWebKit/537.36 (KHTML, like Gecko) Chrome/127.0.0.0 Safari/537.36
   19:     19: Mozilla/5.0 (Windows NT 10.0; Win64; x64) AppleWebKit/537.36 (KHTML, like Gecko) Chrome/136.0.0.0 Safari/537.36
   15:     15: Mozilla/5.0 (compatible; SERankingBacklinksBot/1.0; +https://seranking.com/backlinks-crawler)
   58:     15: Mozilla/5.0 AppleWebKit/537.36 (KHTML, like Gecko; compatible; GPTBot/1.3; +https://openai.com/gptbot)
   13:     13: Mozilla/5.0 AppleWebKit/537.36 (KHTML, like Gecko; compatible; ClaudeBot/1.0; +claudebot@anthropic.com)
   13:     13: Mozilla/5.0 AppleWebKit/537.36 (KHTML, like Gecko) Chrome/123.0.6312.86 Safari/537.36
   12:     12: Mozilla/5.0 (X11; Linux x86_64) AppleWebKit/537.36 (KHTML, like Gecko) Chrome/142.0.0.0 Safari/537.36
   12:     12: Mozilla/5.0 (compatible)
   10:     10: Mozilla/5.0 (X11; Linux x86_64; rv:142.0) Gecko/20100101 Firefox/142.0
    9:      9: Mozilla/5.0 (Windows NT 10.0; Win64; x64) AppleWebKit/537.36 (KHTML, like Gecko) Chrome/88.0.4240.193 Safari/537.36
    9:      9: Mozilla/1.0
    9:      9: Mozilla/5.0 (compatible; GenomeCrawlerd/1.0; +https://www.nokia.com/genomecrawler)
    9:      9: Mozilla/5.0 (X11; Ubuntu; Linux x86_64; rv:71.0) Gecko/20100101 Firefox/71.0
    8:      8: Mozilla/5.0 (compatible; ModatScanner/1.2; +https://modat.io/)
    8:      8: Mozilla/5.0 (Linux; Android 6.0.1; Nexus 5X Build/MMB29P) AppleWebKit/537.36 (KHTML, like Gecko) Chrome/147.0.7727.137 Mobile Safari/537.36 (compatible; Googlebot/2.1; +http://www.google.com/bot.html)
    7:      7: Mozilla/5.0 (Macintosh; Intel Mac OS X 10_15_7) AppleWebKit/537.36 (KHTML, like Gecko) Chrome/108.0.0.0 Safari/537.36
    7:      7: Mozilla/5.0 (Windows NT 10.0; Win64; x64) AppleWebKit/537.36 (KHTML, like Gecko) Chrome/140.0.0.0 Safari/537.36
    7:      7: Mozilla/5.0 (X11; Ubuntu; Linux x86_64; rv:134.0) Gecko/20100101 Firefox/134.0
  510:    459: [not listed: 299 browsers]
(Go To: Top: General Summary: Weekly Report: Daily Report: Daily Summary: Hourly Report: Hour of the Week Summary: Hourly Summary: Domain Report: Organization Report: Host Report: Host Redirection Report: Host Failure Report: Redirected Referrer Report: Failed Referrer Report: Referrer Report: Referring Site Report: Browser Report: Browser Summary: Operating System Report: Status Code Report: File Size Report: File Type Report: Directory Report: Redirection Report: Failure Report: Request Report)
This report lists the vendors of visitors' browsers.
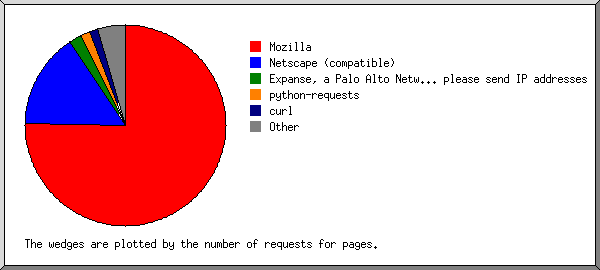
Listing the top 20 browsers by the number of requests for pages, sorted by the number of requests for pages.
 #: #reqs: #pages: browser
--: -----: ------: -------
 1:  3054:   2902: Netscape (compatible)
 2:  1221:   1176: Mozilla
  :    11:     11:   Mozilla/142
  :     9:      9:   Mozilla/71
  :     9:      9:   Mozilla/109
  :     8:      8:   Mozilla/1
  :     7:      7:   Mozilla/134
  :     4:      4:   Mozilla/125
  :     4:      4:   Mozilla/149
  :     3:      3:   Mozilla/127
  :     2:      2:   Mozilla/123
  :     2:      2:   Mozilla/150
 3:    51:     51: Go-http-client
  :    51:     51:   Go-http-client/1
 4:    49:     49: curl
  :    48:     48:   curl/7
 5:    48:     48: Hello from Palo Alto Networks, find out more about our scans in https:
  :    48:     48:   Hello from Palo Alto Networks, find out more about our scans in https://docs-cortex
 6:    37:     37: Shodan-Pull
  :    37:     37:   Shodan-Pull/1
 7:    34:     34: visionheight.com
  :    34:     34:   visionheight.com/scan
 8:    20:     20: python-requests
  :    20:     20:   python-requests/2
 9:     9:      9: Netscape
  :     9:      9:   Netscape/1
10:     7:      7: MSIE
  :     2:      2:   MSIE/8
  :     2:      2:   MSIE/10
  :     2:      2:   MSIE/6
  :     1:      1:   MSIE/9
11:     7:      7: Opera
  :     2:      2:   Opera/9
  :     2:      2:   Opera/11
  :     1:      1:   Opera/8
  :     1:      1:   Opera/5
  :     1:      1:   Opera/6
12:     4:      4: RootEvidence
  :     4:      4:   RootEvidence/1
13:     4:      4: ZoominfoBot (zoominfobot at zoominfo dot com)
14:     3:      3: 8LEGS
15:     3:      3: Hello World
  :     1:      1:   Hello World/1
16:     2:      2: masscan
  :     2:      2:   masscan/1
17:     2:      2: HTTP Banner Detection (https:
  :     2:      2:   HTTP Banner Detection (https://security
18:     2:      2: python-urllib3
  :     2:      2:   python-urllib3/2
19:     2:      2: Python
  :     2:      2:   Python/3
20:     2:      2: FAB-Scraper
  :     2:      2:   FAB-Scraper/1
  :    12:     12: [not listed: 11 browsers]
(Go To: Top: General Summary: Weekly Report: Daily Report: Daily Summary: Hourly Report: Hour of the Week Summary: Hourly Summary: Domain Report: Organization Report: Host Report: Host Redirection Report: Host Failure Report: Redirected Referrer Report: Failed Referrer Report: Referrer Report: Referring Site Report: Browser Report: Browser Summary: Operating System Report: Status Code Report: File Size Report: File Type Report: Directory Report: Redirection Report: Failure Report: Request Report)
This report lists the operating systems used by visitors.
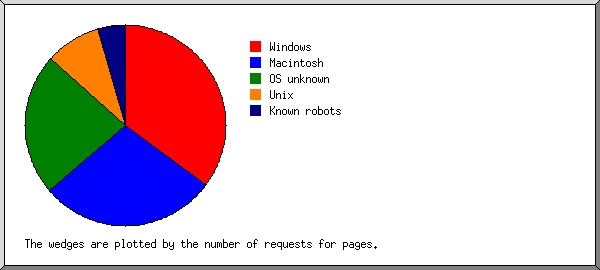
Listing operating systems, sorted by the number of requests for pages.
 #: #reqs: #pages: OS
--: -----: ------: --
 1:  3257:   3162: OS unknown
 2:   580:    579: Macintosh
  :   577:    576:   Unknown Macintosh
  :     2:      2:   Macintosh PowerPC
  :     1:      1:   Macintosh 68k
 3:   375:    372: Windows
  :   320:    318:   Windows NT
  :    47:     46:   Unknown Windows
  :     3:      3:   Windows 2000
  :     2:      2:   Windows XP
  :     2:      2:   Windows CE
  :     1:      1:   Windows 98
 4:   291:    209: Unix
  :   247:    203:   Linux
  :    44:      6:   Other Unix
 5:    70:     54: Known robots
(Go To: Top: General Summary: Weekly Report: Daily Report: Daily Summary: Hourly Report: Hour of the Week Summary: Hourly Summary: Domain Report: Organization Report: Host Report: Host Redirection Report: Host Failure Report: Redirected Referrer Report: Failed Referrer Report: Referrer Report: Referring Site Report: Browser Report: Browser Summary: Operating System Report: Status Code Report: File Size Report: File Type Report: Directory Report: Redirection Report: Failure Report: Request Report)
This report lists the HTTP status codes of all requests.
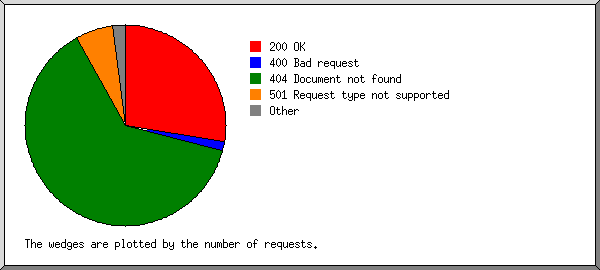
Listing status codes, sorted numerically.
#reqs: status code
-----: -----------
 4650: 200 OK
   21: 301 Document moved permanently
    6: 302 Document found elsewhere
   33: 304 Not modified since last retrieval
  233: 400 Bad request
    6: 403 Access forbidden
11613: 404 Document not found
  152: 405 Method not allowed
    8: 408 Request timeout
  476: 501 Request type not supported
(Go To: Top: General Summary: Weekly Report: Daily Report: Daily Summary: Hourly Report: Hour of the Week Summary: Hourly Summary: Domain Report: Organization Report: Host Report: Host Redirection Report: Host Failure Report: Redirected Referrer Report: Failed Referrer Report: Referrer Report: Referring Site Report: Browser Report: Browser Summary: Operating System Report: Status Code Report: File Size Report: File Type Report: Directory Report: Redirection Report: Failure Report: Request Report)
This report lists the sizes of files.
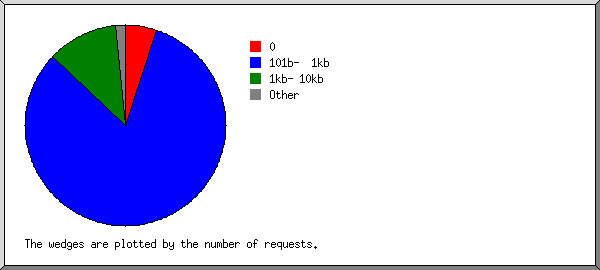
       size: #reqs: %bytes:
-----------: -----: ------:
          0:    96:       :
   1b-  10b:     1:       :
  11b- 100b:     2:       :
 101b-  1kb:  1949:  0.46%:
  1kb- 10kb:  2418:  4.46%:
 10kb-100kb:   166:  2.71%:
100kb-  1Mb:     6:  0.30%:
  1Mb- 10Mb:    38: 20.79%:
 10Mb-100Mb:     7: 71.28%:
(Go To: Top: General Summary: Weekly Report: Daily Report: Daily Summary: Hourly Report: Hour of the Week Summary: Hourly Summary: Domain Report: Organization Report: Host Report: Host Redirection Report: Host Failure Report: Redirected Referrer Report: Failed Referrer Report: Referrer Report: Referring Site Report: Browser Report: Browser Summary: Operating System Report: Status Code Report: File Size Report: File Type Report: Directory Report: Redirection Report: Failure Report: Request Report)
This report lists the extensions of requested files.
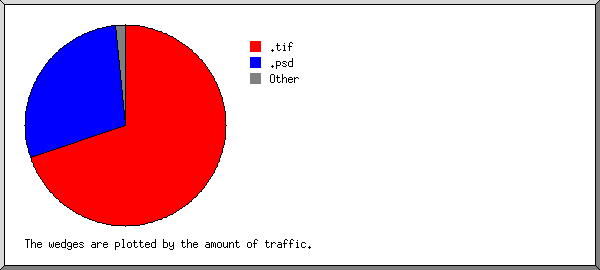
Listing extensions with at least 0.1% of the traffic, sorted by the amount of traffic.
#reqs:  Mbytes: %bytes: extension
-----: -------: ------: ---------
    6:  99.066: 49.22%: .tif
   40:  86.300: 42.87%: .psd
 2477:  10.550:  5.24%: .html [Hypertext Markup Language]
   38:   2.248:  1.12%: .jpg  [JPEG graphics]
 2009:   1.556:  0.77%: [directories]
   31:   1.331:  0.66%: .js   [JavaScript code]
   82:   0.238:  0.12%: [not listed: 5 extensions]
(Go To: Top: General Summary: Weekly Report: Daily Report: Daily Summary: Hourly Report: Hour of the Week Summary: Hourly Summary: Domain Report: Organization Report: Host Report: Host Redirection Report: Host Failure Report: Redirected Referrer Report: Failed Referrer Report: Referrer Report: Referring Site Report: Browser Report: Browser Summary: Operating System Report: Status Code Report: File Size Report: File Type Report: Directory Report: Redirection Report: Failure Report: Request Report)
This report lists the directories from which files were requested. (The figures for each directory include all of its subdirectories.)
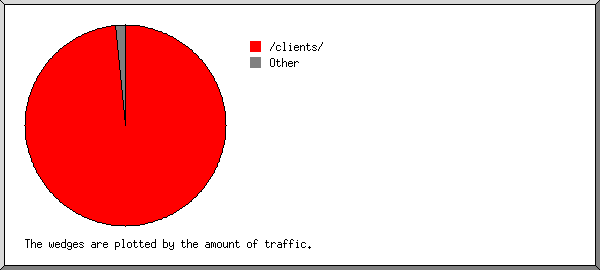
Listing directories with at least 1 byte of traffic, sorted by the amount of traffic.
#reqs:  Mbytes: %bytes: directory
-----: -------: ------: ---------
  343: 185.908: 92.36%: /clients/
   70: 144.146: 71.61%:   /clients/testprint/
 1435:   6.035:  3.00%: /rocketjpgsforselection/
 1365:   4.775:  2.37%:   /rocketjpgsforselection/content/
  820:   3.658:  1.82%: /birchphotoshoot2019/
  800:   3.277:  1.63%:   /birchphotoshoot2019/content/
   55:   2.407:  1.20%: /albert360animated/
   43:   2.376:  1.18%:   /albert360animated/data/
 1781:   0.745:  0.37%: [root directory]
   77:   0.571:  0.28%: /phpMyAdmin-2.2.7-pl1/
    4:   0.397:  0.20%: /Stats/
   19:   0.131:  0.07%: /toshibaallinone/
   16:   0.128:  0.06%: /nexus360/
    3:   0.114:  0.06%: /licklightroomgallery/
   11:   0.107:  0.05%: /lenovodesktop/
   10:   0.104:  0.05%: /hpprinteranimated/
    9:   0.104:  0.05%: /macbook13360/
   10:   0.104:  0.05%: /eka360animated/
    9:   0.101:  0.05%: /chromebook360/
    9:   0.101:  0.05%: /vizioallinone/
    8:   0.099:  0.05%: /delllaptop360/
    8:   0.099:  0.05%: /samsung4s/
    8:   0.099:  0.05%: /lenovoyoga360/
    7:   0.096:  0.05%: /asuswifi/
    3:   0.087:  0.04%: /JPEG/
    3:   0.025:  0.01%: /richardfuneralserviceflashgallery/
    2:   0.016:  0.01%: /flashblackandwhitegalleryacrecoffeetest/
    2:   0.016:  0.01%: /appleproductflash/
    1:   0.008:       : /marfa2014/
    2:   0.006:       : /toshiba360/
    6:   0.006:       : http://
    2:   0.003:       : /swf/
    1:   0.003:       : /macbook360/
    2:   0.000:       : /pages/
    1:   0.000:       : /images/
    1:   0.000:       : /_icons/
    1:   0.000:       : /adodb/
   14:   0.000:       : [not listed: 1 directory]
(Go To: Top: General Summary: Weekly Report: Daily Report: Daily Summary: Hourly Report: Hour of the Week Summary: Hourly Summary: Domain Report: Organization Report: Host Report: Host Redirection Report: Host Failure Report: Redirected Referrer Report: Failed Referrer Report: Referrer Report: Referring Site Report: Browser Report: Browser Summary: Operating System Report: Status Code Report: File Size Report: File Type Report: Directory Report: Redirection Report: Failure Report: Request Report)
This report lists the files that caused requests to be redirected to another file. (Usually directories with the final slash missing, or CGI scripts that forced redirections.)
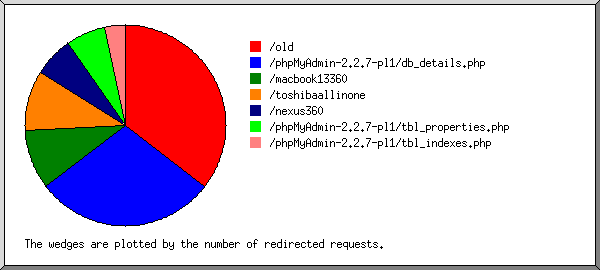
Listing files, sorted by the number of redirected requests.
#reqs: file
-----: ----
    6: /phpMyAdmin-2.2.7-pl1/db_details.php
    6: /macbook13360
    4: /clients/142tenthst
    3: /clients/142tenthstx3
    2: /toshibaallinone
    2: /clients/142tenthstx2
    2: /nexus360
    2: /clients/142tenthstx4
(Go To: Top: General Summary: Weekly Report: Daily Report: Daily Summary: Hourly Report: Hour of the Week Summary: Hourly Summary: Domain Report: Organization Report: Host Report: Host Redirection Report: Host Failure Report: Redirected Referrer Report: Failed Referrer Report: Referrer Report: Referring Site Report: Browser Report: Browser Summary: Operating System Report: Status Code Report: File Size Report: File Type Report: Directory Report: Redirection Report: Failure Report: Request Report)
This report lists the files that caused failures, for example files not found.
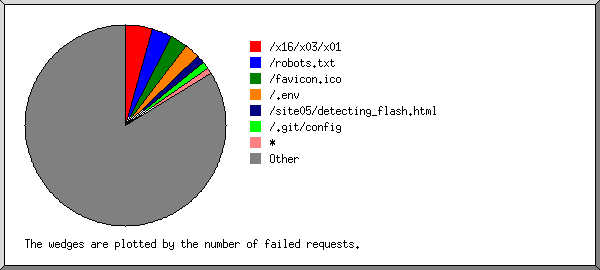
Listing the top 30 files by the number of failed requests, sorted by the number of failed requests.
#reqs: file
-----: ----
  414: /robots.txt
  207: /x16/x03/x01
  158: /favicon.ico
  129: /
   35:   /?%ADd+allow_url_include%3d1+%ADd+auto_prepend_file%3dphp://input
  114: /.env
  101: /index.php
   32:   /index.php?lang=../../../../../../../../tmp/index1
   32:   /index.php?lang=../../../../../../../../usr/local/lib/php/pearcmd&+config-create+/&/<?echo(md5(\"hi\"));?>+/tmp/index1.php
   32:   /index.php?s=/index/\\think\\app/invokefunction&function=call_user_func_array&vars[0]=md5&vars[1][]=Hello
   70: /site05/detecting_flash.html
   67: /SDK/webLanguage
   64: /.git/config
   50: /x03
   50: /Stats/() { ignored; }; echo content-type: text/html; echo ; /bin/cat /etc/passwd
   48: /app/.env
   44: /bin/sh
   43: /phpinfo.php
   41: /.env.production
   41: /login
   39: /backend/.env
   39: /cgi-bin/%2ee2e/e2ee2e/e2ee2e/e2ee2e/e2ee2e/e2ee2e/e2ee2e/bin/sh
   39: /api/.env
   38: www.google.com:443
   37: /vendor/phpunit/phpunit/src/Util/PHP/eval-stdin.php
   37: /hello.world
   37:   /hello.world?%ADd+allow_url_include%3d1+%ADd+auto_prepend_file%3dphp://input
   35: /vendor/phpunit/src/Util/PHP/eval-stdin.php
   35: /vendor/phpunit/phpunit/LICENSE/eval-stdin.php
   35: /vendor/phpunit/phpunit/Util/PHP/eval-stdin.php
   35: /phpunit/phpunit/src/Util/PHP/eval-stdin.php
   35: /vendor/vendor/phpunit/phpunit/src/Util/PHP/eval-stdin.php
   35: /vendor/phpunit/Util/PHP/eval-stdin.php
   34: /lib/phpunit/Util/PHP/eval-stdin.php
   34: /yii/vendor/phpunit/phpunit/src/Util/PHP/eval-stdin.php
10331: [not listed: 5,146 files]
(Go To: Top: General Summary: Weekly Report: Daily Report: Daily Summary: Hourly Report: Hour of the Week Summary: Hourly Summary: Domain Report: Organization Report: Host Report: Host Redirection Report: Host Failure Report: Redirected Referrer Report: Failed Referrer Report: Referrer Report: Referring Site Report: Browser Report: Browser Summary: Operating System Report: Status Code Report: File Size Report: File Type Report: Directory Report: Redirection Report: Failure Report: Request Report)
This report lists the files on the site.
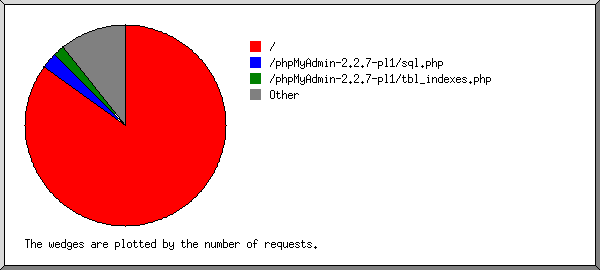
Listing the top 100 files by the number of requests, sorted by the number of requests.
#reqs:  Mbytes: %bytes:  %reqs: %pages: file
-----: -------: ------: ------: ------: ----
 1775:   0.741:  0.37%: 37.90%: 39.57%: /
   22:   0.007:       :  0.47%:  0.49%:   /?phpinfo=-1
   40:  86.300: 42.87%:  0.85%:       : /clients/testprint/_DSC1281_TEST_PRINT.psd
   28:   0.023:  0.01%:  0.60%:  0.62%: /clients/142tenthst/pages/looking at st __.html
   28:   0.022:  0.01%:  0.60%:  0.62%: /clients/142tenthst/pages/office horz__.html
   28:   0.023:  0.01%:  0.60%:  0.62%: /clients/142tenthst/pages/bath bar horz __.html
   27:   0.021:  0.01%:  0.58%:  0.60%: /clients/142tenthst/pages/bar vert __.html
   27:   0.021:  0.01%:  0.58%:  0.60%: /clients/142tenthst/pages/kitch __.html
   26:   0.086:  0.04%:  0.56%:  0.58%: /clients/singleimages4joan/
   26:   0.020:  0.01%:  0.56%:  0.58%: /clients/142tenthst/pages/glass bar.html
   26:   0.022:  0.01%:  0.56%:  0.58%: /clients/testprint/
   23:   0.029:  0.01%:  0.49%:  0.51%: /clients/
   20:   0.158:  0.08%:  0.43%:  0.45%: /phpMyAdmin-2.2.7-pl1/translators.html
   14:   0.000:       :  0.30%:  0.31%: /old/
   14:   0.016:  0.01%:  0.30%:  0.31%: /toshibaallinone/
   12:   0.031:  0.02%:  0.26%:  0.27%: /albert360animated/
   11:   0.013:  0.01%:  0.23%:  0.25%: /nexus360/
    9:   0.017:  0.01%:  0.19%:       : /phpMyAdmin-2.2.7-pl1/main.php
    8:   0.019:  0.01%:  0.17%:  0.18%: /lenovodesktop/
    7:   0.028:  0.01%:  0.15%:  0.16%: /birchphotoshoot2019/content/Birch_-105_FOR_SELECTION_ONLY_large.html
    7:   0.028:  0.01%:  0.15%:  0.16%: /birchphotoshoot2019/content/Birch_-103_FOR_SELECTION_ONLY_large.html
    7:   0.028:  0.01%:  0.15%:  0.16%: /birchphotoshoot2019/content/Birch_-101_FOR_SELECTION_ONLY_large.html
    7:   0.058:  0.03%:  0.15%:  0.16%: /clients/142tenthstx2/
    7:   0.028:  0.01%:  0.15%:  0.16%: /birchphotoshoot2019/content/Birch_-56_FOR_SELECTION_ONLY_large.html
    7:   0.028:  0.01%:  0.15%:  0.16%: /birchphotoshoot2019/content/Birch_-54_FOR_SELECTION_ONLY_large.html
    7:   0.016:  0.01%:  0.15%:  0.16%: /hpprinteranimated/
    7:   0.028:  0.01%:  0.15%:  0.16%: /birchphotoshoot2019/content/Birch_-209_FOR_SELECTION_ONLY_large.html
    7:   0.028:  0.01%:  0.15%:  0.16%: /birchphotoshoot2019/content/Birch_-228_FOR_SELECTION_ONLY_large.html
    7:   0.028:  0.01%:  0.15%:  0.16%: /birchphotoshoot2019/content/Birch_-52_FOR_SELECTION_ONLY_large.html
    7:   0.028:  0.01%:  0.15%:  0.16%: /birchphotoshoot2019/content/Birch_-226_FOR_SELECTION_ONLY_large.html
    7:   0.028:  0.01%:  0.15%:  0.16%: /birchphotoshoot2019/content/Birch_-31_FOR_SELECTION_ONLY_large.html
    7:   0.028:  0.01%:  0.15%:  0.16%: /birchphotoshoot2019/content/Birch_-50_FOR_SELECTION_ONLY_large.html
    7:   0.034:  0.02%:  0.15%:  0.16%: /clients/142tenthst/
    7:   0.028:  0.01%:  0.15%:  0.16%: /birchphotoshoot2019/content/Birch_-222_FOR_SELECTION_ONLY_large.html
    7:   0.028:  0.01%:  0.15%:  0.16%: /birchphotoshoot2019/content/Birch_-220_FOR_SELECTION_ONLY_large.html
    7:   0.028:  0.01%:  0.15%:  0.16%: /birchphotoshoot2019/content/Birch_-119_FOR_SELECTION_ONLY_large.html
    7:   0.028:  0.01%:  0.15%:  0.16%: /birchphotoshoot2019/content/Birch_-117_FOR_SELECTION_ONLY_large.html
    7:   0.028:  0.01%:  0.15%:  0.16%: /birchphotoshoot2019/content/Birch_-115_FOR_SELECTION_ONLY_large.html
    7:   0.028:  0.01%:  0.15%:  0.16%: /birchphotoshoot2019/content/Birch_-113_FOR_SELECTION_ONLY_large.html
    7:   0.028:  0.01%:  0.15%:  0.16%: /birchphotoshoot2019/content/Birch_-111_FOR_SELECTION_ONLY_large.html
    7:   0.028:  0.01%:  0.15%:  0.16%: /birchphotoshoot2019/content/Birch_-49_FOR_SELECTION_ONLY_large.html
    7:   0.028:  0.01%:  0.15%:  0.16%: /birchphotoshoot2019/content/Birch_-47_FOR_SELECTION_ONLY_large.html
    7:   0.028:  0.01%:  0.15%:  0.16%: /birchphotoshoot2019/content/Birch_-45_FOR_SELECTION_ONLY_large.html
    7:   0.028:  0.01%:  0.15%:  0.16%: /birchphotoshoot2019/content/Birch_-219_FOR_SELECTION_ONLY_large.html
    7:   0.013:  0.01%:  0.15%:       : /phpMyAdmin-2.2.7-pl1/tbl_qbe.php
    7:   0.028:  0.01%:  0.15%:  0.16%: /birchphotoshoot2019/content/Birch_-108_FOR_SELECTION_ONLY_large.html
    7:   0.028:  0.01%:  0.15%:  0.16%: /birchphotoshoot2019/content/Birch_-106_FOR_SELECTION_ONLY_large.html
    7:   0.028:  0.01%:  0.15%:  0.16%: /birchphotoshoot2019/content/Birch_-104_FOR_SELECTION_ONLY_large.html
    7:   0.028:  0.01%:  0.15%:  0.16%: /birchphotoshoot2019/content/Birch_-102_FOR_SELECTION_ONLY_large.html
    7:   0.028:  0.01%:  0.15%:  0.16%: /birchphotoshoot2019/content/Birch_-19_FOR_SELECTION_ONLY_large.html
    7:   0.028:  0.01%:  0.15%:  0.16%: /birchphotoshoot2019/content/Birch_-57_FOR_SELECTION_ONLY_large.html
    7:   0.028:  0.01%:  0.15%:  0.16%: /birchphotoshoot2019/content/Birch_-229_FOR_SELECTION_ONLY_large.html
    7:   0.028:  0.01%:  0.15%:  0.16%: /birchphotoshoot2019/content/Birch_-53_FOR_SELECTION_ONLY_large.html
    7:   0.028:  0.01%:  0.15%:  0.16%: /birchphotoshoot2019/content/Birch_-227_FOR_SELECTION_ONLY_large.html
    7:   0.028:  0.01%:  0.15%:  0.16%: /birchphotoshoot2019/content/Birch_-51_FOR_SELECTION_ONLY_large.html
    7:   0.028:  0.01%:  0.15%:  0.16%: /birchphotoshoot2019/content/Birch_-118_FOR_SELECTION_ONLY_large.html
    7:   0.028:  0.01%:  0.15%:  0.16%: /birchphotoshoot2019/content/Birch_-116_FOR_SELECTION_ONLY_large.html
    7:   0.028:  0.01%:  0.15%:  0.16%: /birchphotoshoot2019/content/Birch_-114_FOR_SELECTION_ONLY_large.html
    7:   0.028:  0.01%:  0.15%:  0.16%: /birchphotoshoot2019/content/Birch_-112_FOR_SELECTION_ONLY_large.html
    7:   0.028:  0.01%:  0.15%:  0.16%: /birchphotoshoot2019/content/Birch_-110_FOR_SELECTION_ONLY_large.html
    7:   0.028:  0.01%:  0.15%:  0.16%: /birchphotoshoot2019/content/Birch_-48_FOR_SELECTION_ONLY_large.html
    7:   0.028:  0.01%:  0.15%:  0.16%: /birchphotoshoot2019/content/Birch_-27_FOR_SELECTION_ONLY_large.html
    7:   0.028:  0.01%:  0.15%:  0.16%: /birchphotoshoot2019/content/Birch_-46_FOR_SELECTION_ONLY_large.html
    7:   0.028:  0.01%:  0.15%:  0.16%: /birchphotoshoot2019/content/Birch_-44_FOR_SELECTION_ONLY_large.html
    7:   0.028:  0.01%:  0.15%:  0.16%: /birchphotoshoot2019/content/Birch_-231_FOR_SELECTION_ONLY_large.html
    7:   0.016:  0.01%:  0.15%:  0.16%: /eka360animated/
    7:   0.028:  0.01%:  0.15%:  0.16%: /birchphotoshoot2019/content/Birch_-109_FOR_SELECTION_ONLY_large.html
    6:   0.049:  0.02%:  0.13%:  0.13%: /clients/142tenthstx4/
    6:   0.016:  0.01%:  0.13%:  0.13%: /macbook13360/
    6:   0.014:  0.01%:  0.13%:  0.13%: /chromebook360/
    6:   0.014:  0.01%:  0.13%:  0.13%: /vizioallinone/
    5:   0.020:  0.01%:  0.11%:  0.11%: /birchphotoshoot2019/content/Birch_-124_FOR_SELECTION_ONLY_large.html
    5:   0.020:  0.01%:  0.11%:  0.11%: /birchphotoshoot2019/content/Birch_-141_FOR_SELECTION_ONLY_large.html
    5:   0.020:  0.01%:  0.11%:  0.11%: /birchphotoshoot2019/content/Birch_-120_FOR_SELECTION_ONLY_large.html
    5:   0.024:  0.01%:  0.11%:  0.11%: /clients/142tenthstx3/
    5:   0.020:  0.01%:  0.11%:  0.11%: /birchphotoshoot2019/content/Birch_-58_FOR_SELECTION_ONLY_large.html
    5:   0.020:  0.01%:  0.11%:  0.11%: /birchphotoshoot2019/content/Birch_-249_FOR_SELECTION_ONLY_large.html
    5:   0.020:  0.01%:  0.11%:  0.11%: /birchphotoshoot2019/content/Birch_-268_FOR_SELECTION_ONLY_large.html
    5:   0.020:  0.01%:  0.11%:  0.11%: /birchphotoshoot2019/content/Birch_-266_FOR_SELECTION_ONLY_large.html
    5:   0.020:  0.01%:  0.11%:  0.11%: /birchphotoshoot2019/content/Birch_-207_FOR_SELECTION_ONLY_large.html
    5:   0.020:  0.01%:  0.11%:  0.11%: /birchphotoshoot2019/content/Birch_-245_FOR_SELECTION_ONLY_large.html
    5:   0.020:  0.01%:  0.11%:  0.11%: /birchphotoshoot2019/content/Birch_-264_FOR_SELECTION_ONLY_large.html
    5:   0.020:  0.01%:  0.11%:  0.11%: /birchphotoshoot2019/content/Birch_-205_FOR_SELECTION_ONLY_large.html
    5:   0.020:  0.01%:  0.11%:  0.11%: /birchphotoshoot2019/content/Birch_-243_FOR_SELECTION_ONLY_large.html
    5:   0.020:  0.01%:  0.11%:  0.11%: /birchphotoshoot2019/content/Birch_-262_FOR_SELECTION_ONLY_large.html
    5:   0.020:  0.01%:  0.11%:  0.11%: /birchphotoshoot2019/content/Birch_-241_FOR_SELECTION_ONLY_large.html
    5:   0.020:  0.01%:  0.11%:  0.11%: /birchphotoshoot2019/content/Birch_-260_FOR_SELECTION_ONLY_large.html
    5:   0.020:  0.01%:  0.11%:  0.11%: /birchphotoshoot2019/content/Birch_-201_FOR_SELECTION_ONLY_large.html
    5:   0.020:  0.01%:  0.11%:  0.11%: /birchphotoshoot2019/content/Birch_-199_FOR_SELECTION_ONLY_large.html
    5:   0.020:  0.01%:  0.11%:  0.11%: /birchphotoshoot2019/content/Birch_-197_FOR_SELECTION_ONLY_large.html
    5:   0.020:  0.01%:  0.11%:  0.11%: /birchphotoshoot2019/content/Birch_-195_FOR_SELECTION_ONLY_large.html
    5:   0.020:  0.01%:  0.11%:  0.11%: /birchphotoshoot2019/content/Birch_-193_FOR_SELECTION_ONLY_large.html
    5:   0.020:  0.01%:  0.11%:  0.11%: /birchphotoshoot2019/content/Birch_-191_FOR_SELECTION_ONLY_large.html
    5:   0.058:  0.03%:  0.11%:       : /phpMyAdmin-2.2.7-pl1/LICENSE
    5:   0.020:  0.01%:  0.11%:  0.11%: /birchphotoshoot2019/content/Birch_-132_FOR_SELECTION_ONLY_large.html
    5:   0.020:  0.01%:  0.11%:  0.11%: /birchphotoshoot2019/content/Birch_-130_FOR_SELECTION_ONLY_large.html
    5:   0.020:  0.01%:  0.11%:  0.11%: /birchphotoshoot2019/content/Birch_-259_FOR_SELECTION_ONLY_large.html
    5:   0.020:  0.01%:  0.11%:  0.11%: /birchphotoshoot2019/content/Birch_-238_FOR_SELECTION_ONLY_large.html
    5:   0.020:  0.01%:  0.11%:  0.11%: /birchphotoshoot2019/content/Birch_-257_FOR_SELECTION_ONLY_large.html
    5:   0.020:  0.01%:  0.11%:  0.11%: /birchphotoshoot2019/content/Birch_-276_FOR_SELECTION_ONLY_large.html
    5:   0.020:  0.01%:  0.11%:  0.11%: /birchphotoshoot2019/content/Birch_-217_FOR_SELECTION_ONLY_large.html
 2031: 111.594: 55.44%: 43.37%: 42.24%: [not listed: 958 files]
(Go To: Top: General Summary: Weekly Report: Daily Report: Daily Summary: Hourly Report: Hour of the Week Summary: Hourly Summary: Domain Report: Organization Report: Host Report: Host Redirection Report: Host Failure Report: Redirected Referrer Report: Failed Referrer Report: Referrer Report: Referring Site Report: Browser Report: Browser Summary: Operating System Report: Status Code Report: File Size Report: File Type Report: Directory Report: Redirection Report: Failure Report: Request Report)

