 Web Server Statistics for Cardin Studio Web Server Statistics for Cardin Studio
(Go To: Top: General Summary: Weekly Report: Daily Report: Daily Summary: Hour of the Week Summary: Hourly Summary: Domain Report: Organization Report: Host Report: Host Redirection Report: Host Failure Report: Redirected Referrer Report: Failed Referrer Report: Referrer Report: Referring Site Report: Browser Report: Browser Summary: Operating System Report: Status Code Report: File Size Report: File Type Report: Directory Report: Redirection Report: Failure Report: Request Report)
This report contains overall statistics.
Successful requests: 5,079
Average successful requests per day: 163
Successful requests for pages: 3,682
Average successful requests for pages per day: 118
Failed requests: 27,355
Redirected requests: 57
Distinct files requested: 1,136
Distinct hosts served: 2,095
Corrupt logfile lines: 26
Data transferred: 208.976 megabytes
Average data transferred per day: 6.742 megabytes
(Go To: Top: General Summary: Weekly Report: Daily Report: Daily Summary: Hour of the Week Summary: Hourly Summary: Domain Report: Organization Report: Host Report: Host Redirection Report: Host Failure Report: Redirected Referrer Report: Failed Referrer Report: Referrer Report: Referring Site Report: Browser Report: Browser Summary: Operating System Report: Status Code Report: File Size Report: File Type Report: Directory Report: Redirection Report: Failure Report: Request Report)
This report lists the activity in each week.
Each unit ( ) represents 2 megabytes
or part thereof.
) represents 2 megabytes
or part thereof.
week beg.: #reqs: Mbytes: %bytes: ---------: -----: -------: ------: Dec/28/25: 292: 21.440: 10.26%:Busiest week: week beginning Jan/25/26 (51.094 megabytes).Jan/25/26: 1938: 51.094: 24.45%:

(Go To: Top: General Summary: Weekly Report: Daily Report: Daily Summary: Hour of the Week Summary: Hourly Summary: Domain Report: Organization Report: Host Report: Host Redirection Report: Host Failure Report: Redirected Referrer Report: Failed Referrer Report: Referrer Report: Referring Site Report: Browser Report: Browser Summary: Operating System Report: Status Code Report: File Size Report: File Type Report: Directory Report: Redirection Report: Failure Report: Request Report)
This report lists the activity in each day.
Each unit () represents 1.5 megabytes
or part thereof.
date: #reqs: Mbytes: %bytes: ---------: -----: -------: ------: Jan/ 1/26: 86: 0.046: 0.02%:Busiest day: Jan/29/26 (33.513 megabytes).Jan/ 9/26: 340: 11.402: 5.46%:
(Go To: Top: General Summary: Weekly Report: Daily Report: Daily Summary: Hour of the Week Summary: Hourly Summary: Domain Report: Organization Report: Host Report: Host Redirection Report: Host Failure Report: Redirected Referrer Report: Failed Referrer Report: Referrer Report: Referring Site Report: Browser Report: Browser Summary: Operating System Report: Status Code Report: File Size Report: File Type Report: Directory Report: Redirection Report: Failure Report: Request Report)
This report lists the total activity for each day of the week, summed over all the weeks in the report.
Each unit () represents 2.5 megabytes
or part thereof.
day: #reqs: Mbytes: %bytes: ---: -----: -------: ------: Sun: 563: 0.708: 0.34%:Fri: 896: 49.480: 23.68%:
(Go To: Top: General Summary: Weekly Report: Daily Report: Daily Summary: Hour of the Week Summary: Hourly Summary: Domain Report: Organization Report: Host Report: Host Redirection Report: Host Failure Report: Redirected Referrer Report: Failed Referrer Report: Referrer Report: Referring Site Report: Browser Report: Browser Summary: Operating System Report: Status Code Report: File Size Report: File Type Report: Directory Report: Redirection Report: Failure Report: Request Report)
This report lists the total activity for each hour of the week, summed over all the weeks in the report.
Each unit () represents 10 requests
for pages or part thereof.
hour: #reqs: #pages: ---------------------: -----: ------: Sun 12:00 AM- 1:00 AM: 15: 14:
(Go To: Top: General Summary: Weekly Report: Daily Report: Daily Summary: Hour of the Week Summary: Hourly Summary: Domain Report: Organization Report: Host Report: Host Redirection Report: Host Failure Report: Redirected Referrer Report: Failed Referrer Report: Referrer Report: Referring Site Report: Browser Report: Browser Summary: Operating System Report: Status Code Report: File Size Report: File Type Report: Directory Report: Redirection Report: Failure Report: Request Report)
This report lists the total activity for each hour of the day, summed over all the days in the report.
Each unit () represents 1 megabytes
or part thereof.
hour: #reqs: Mbytes: %bytes: ----: -----: -------: ------: 0: 139: 13.693: 6.55%:
(Go To: Top: General Summary: Weekly Report: Daily Report: Daily Summary: Hour of the Week Summary: Hourly Summary: Domain Report: Organization Report: Host Report: Host Redirection Report: Host Failure Report: Redirected Referrer Report: Failed Referrer Report: Referrer Report: Referring Site Report: Browser Report: Browser Summary: Operating System Report: Status Code Report: File Size Report: File Type Report: Directory Report: Redirection Report: Failure Report: Request Report)
This report lists the countries of the computers which requested files.
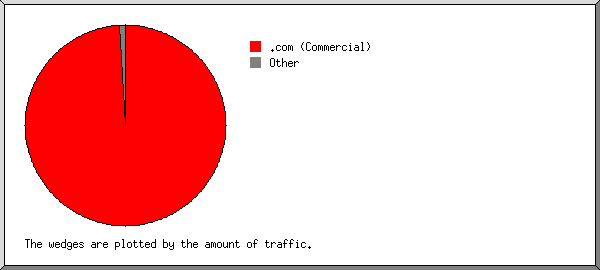
Listing domains, sorted by the amount of traffic.
#reqs:  Mbytes: %bytes: domain
-----: -------: ------: ------
  919: 182.352: 87.26%: .com (Commercial)
 1150:  21.207: 10.15%: .net (Networks)
 2387:   3.009:  1.44%: [unresolved numerical addresses]
   49:   1.737:  0.83%: .bd (Bangladesh)
  264:   0.280:  0.13%: [unknown domain]
    5:   0.124:  0.06%: .br (Brazil)
    2:   0.112:  0.05%: .ar (Argentina)
  130:   0.056:  0.03%: .org (Non Profit Making Organizations)
   42:   0.039:  0.02%: .io (British Indian Ocean Territory)
   45:   0.019:  0.01%: .ai (Anguilla)
   20:   0.007:       : .us (United States)
    8:   0.004:       : .de (Germany)
    9:   0.003:       : .nl (Netherlands)
    7:   0.003:       : .uk (United Kingdom)
    6:   0.002:       : .lt (Lithuania)
    5:   0.002:       : .cn (China)
    4:   0.001:       : .arpa (Arpanet)
    3:   0.001:       : .vn (Vietnam)
    4:   0.001:       : .ru (Russia)
    3:   0.001:       : .it (Italy)
    2:   0.000:       : .jp (Japan)
    2:   0.000:       : .ua (Ukraine)
    2:   0.000:       : .sh (Saint Helena)
    1:   0.000:       : .ba (Bosnia-Herzegovina)
    1:   0.000:       : .do (Dominican Republic)
    1:   0.000:       : .by (Belarus)
    1:   0.000:       : .pl (Poland)
    1:   0.000:       : .cg (Congo)
    1:   0.000:       : .am (Armenia)
    1:   0.000:       : .tz (Tanzania)
    1:   0.000:       : .cr (Costa Rica)
    1:   0.000:       : .se (Sweden)
    1:   0.000:       : .gr (Greece)
    1:   0.000:       : .edu (US Higher Education)
(Go To: Top: General Summary: Weekly Report: Daily Report: Daily Summary: Hour of the Week Summary: Hourly Summary: Domain Report: Organization Report: Host Report: Host Redirection Report: Host Failure Report: Redirected Referrer Report: Failed Referrer Report: Referrer Report: Referring Site Report: Browser Report: Browser Summary: Operating System Report: Status Code Report: File Size Report: File Type Report: Directory Report: Redirection Report: Failure Report: Request Report)
This report lists the organizations of the computers which requested files.
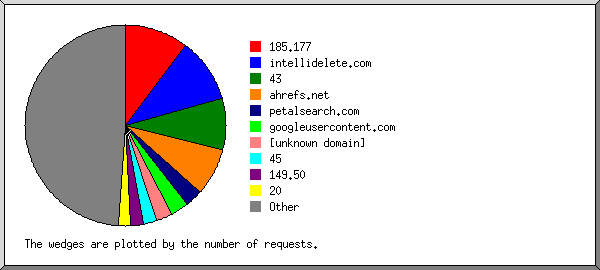
Listing the top 20 organizations by the number of requests, sorted by the number of requests.
#reqs: %bytes: organization
-----: ------: ------------
  624:  0.51%: ahrefs.net
  372:  0.14%: 43
  365:  9.47%: sbcglobal.net
  288:  0.06%: 95
  264:  0.13%: [unknown domain]
  246:  0.05%: 185.177
  229: 87.04%: petalsearch.com
  146:  0.02%: googleusercontent.com
  124:  0.12%: 141.11
  120:  0.02%: 87
   90:  0.02%: amazonaws.com
   67:  0.12%: 45
   58:  0.01%: internet-census.org
   57:  0.01%: group-ib.com
   57:  0.01%: censys-scanner.com
   57:  0.05%: 109
   51:  0.01%: 89
   49:  0.01%: 49
   49:  0.83%: bd
   47:  0.01%: 170.106
 1719:  1.34%: [not listed: 316 organizations]
(Go To: Top: General Summary: Weekly Report: Daily Report: Daily Summary: Hour of the Week Summary: Hourly Summary: Domain Report: Organization Report: Host Report: Host Redirection Report: Host Failure Report: Redirected Referrer Report: Failed Referrer Report: Referrer Report: Referring Site Report: Browser Report: Browser Summary: Operating System Report: Status Code Report: File Size Report: File Type Report: Directory Report: Redirection Report: Failure Report: Request Report)
This report lists the computers which requested files.
Listing the top 100 hosts by the number of requests, sorted by the number of requests.
#reqs:  Mbytes: %bytes: host
-----: -------: ------: ----
  365:  19.787:  9.47%: 104-56-112-189.lightspeed.sntcca.sbcglobal.net
  217:   0.093:  0.04%: 95.214.54.147
  215:   0.094:  0.05%: 185.177.72.38
   69:   0.029:  0.01%: 95.214.55.71
   57:   0.024:  0.01%: rnd.group-ib.com
   49:   1.737:  0.83%: 113-11-49-39-smile.com.bd
   45:   0.019:  0.01%: scan.cypex.ai
   39:   0.102:  0.05%: vmi2530330.contaboserver.net
   38:  25.042: 11.98%: petalbot-114-119-153-56.petalsearch.com
   36:   0.092:  0.04%: ns3076805.ip-217-182-194.eu
   34:   0.014:  0.01%: 204.76.203.18.ptr.pfcloud.network
   34:   0.014:  0.01%: 87.121.84.46
   32:   9.672:  4.63%: petalbot-114-119-144-7.petalsearch.com
   32:   0.013:  0.01%: credentialblather.org
   31:  17.372:  8.31%: petalbot-114-119-155-111.petalsearch.com
   31:  20.526:  9.82%: petalbot-114-119-136-174.petalsearch.com
   31:   0.013:  0.01%: 204.76.203.69.ptr.pfcloud.network
   29:   0.012:  0.01%: ip-40-174.4vendeta.com
   28:   0.010:  0.01%: 139-144-52-241.ip.linodeusercontent.com
   28:   0.055:  0.03%: 141.11.163.121
   27:  10.680:  5.11%: petalbot-114-119-129-199.petalsearch.com
   26:   0.052:  0.03%: 109.176.204.69
   26:   0.051:  0.02%: 140.99.84.229
   26:   0.050:  0.02%: 109.176.205.224
   25:  13.685:  6.55%: petalbot-114-119-133-63.petalsearch.com
   24:   0.046:  0.02%: 154.16.70.28
   23:  14.149:  6.77%: petalbot-114-119-159-16.petalsearch.com
   23:   0.044:  0.02%: 185.194.206.199
   23:   0.009:       : 87.121.84.15
   23:   0.009:       : 87.121.84.38
   22:   0.043:  0.02%: 185.226.56.168
   22:  70.761: 33.86%: petalbot-114-119-162-58.petalsearch.com
   21:   0.041:  0.02%: 178.208.180.189
   21:   0.041:  0.02%: 185.226.57.168
   20:   0.036:  0.02%: discovery-crawler11.blex.seranking.com
   20:   0.038:  0.02%: 37.202.196.250
   20:   0.039:  0.02%: 141.11.170.244
   20:   0.039:  0.02%: 141.11.171.67
   20:   0.039:  0.02%: 178.208.181.154
   19:   0.037:  0.02%: 141.11.162.126
   19:   0.037:  0.02%: 141.11.168.44
   19:   0.008:       : 176.65.149.159.ptr.pfcloud.network
   19:   0.037:  0.02%: 45.146.203.93
   19:   0.008:       : 87.121.84.51
   18:   0.035:  0.02%: 141.11.169.46
   18:   0.387:  0.19%: 74.7.242.18
   17:   0.033:  0.02%: 37.202.196.183
   16:   0.006:       : 195.178.110.108
   16:   0.006:       : 89.42.231.200
   16:   0.006:       : 87.121.84.37
   15:   0.006:       : 89.42.231.239
   15:   0.006:       : 45.135.194.23.ptr.pfcloud.network
   14:   0.006:       : hosted-by.host-palace.com
   14:   0.005:       : ns1016880.ip-15-204-196.us
   14:   0.027:  0.01%: 154.16.71.11
   14:   0.006:       : bridge.rusticperpetualanger.com
   14:   0.027:  0.01%: 140.99.85.93
   13:   0.005:       : srv-91-224-92-14.serveroffer.net
   13:   0.005:       : 45.148.10.143
   13:   0.005:       : provided-by-visuhost.com
   12:   0.023:  0.01%: ns31424501.ip-54-38-38.eu
   12:   0.005:       : 195.178.110.199
   11:   0.004:       : 78.153.140.151
   10:   0.004:       : 130.12.180.18
    9:   0.031:  0.01%: ns3107735.ip-54-36-179.eu
    9:   0.003:       : 45.194.92.18
    9:   0.003:       : 178.22.24.64
    9:   0.003:       : continued.zonogicism.nl
    8:   0.003:       : testdant.local
    8:   0.003:       : 78.153.140.224
    8:   0.005:       : 185.177.72.13
    8:   0.005:       : 185.177.72.51
    8:   0.005:       : 185.177.72.56
    8:   0.003:       : flowers-st.com
    8:   0.211:  0.10%: 57.81-167-26.customer.lyse.net
    8:   0.003:       : 165.154.206.35
    8:   0.000:       : srv-91-224-92-121.serveroffer.net
    8:   0.001:       : 176.65.148.66.ptr.pfcloud.network
    7:   0.003:       : scan-57-3.security.ipip.net
    7:   0.003:       : 89.42.231.244
    7:   0.003:       : 151.242.144.223
    6:   0.002:       : moldserv.me
    6:   0.002:       : shopstore.lt
    6:   0.002:       : igutic.earnningipti.co.uk
    6:   0.004:       : ns3156800.ip-51-83-6.eu
    6:   0.030:  0.01%: 216.244.66.244
    6:   0.002:       : 176.65.139.8
    5:   0.002:       : 43.157.172.39
    5:   0.002:       : 204.76.203.8.ptr.pfcloud.network
    5:   0.002:       : 92.63.197.197
    5:   0.002:       : 89.42.231.186
    5:   0.002:       : sh-ams-nl-gd12-wk103a.internet-census.org
    5:   0.004:       : 43.130.78.203
    5:   0.002:       : 36.41.75.167
    5:   0.002:       : ns512853.ip-167-114-156.net
    5:   0.002:       : 560a1c98-e6b1-4ded-b9ea-7946c314a6b5.nl-ams-1.baremetal.scw.cloud
    5:   0.002:       : 43.163.104.54
    5:   0.003:       : 43.157.38.131
    5:   0.002:       : 170.106.180.246
    5:   0.002:       : unn-169-150-198-85.datapacket.com
 2589:   3.263:  1.56%: [not listed: 1,995 hosts]
(Go To: Top: General Summary: Weekly Report: Daily Report: Daily Summary: Hour of the Week Summary: Hourly Summary: Domain Report: Organization Report: Host Report: Host Redirection Report: Host Failure Report: Redirected Referrer Report: Failed Referrer Report: Referrer Report: Referring Site Report: Browser Report: Browser Summary: Operating System Report: Status Code Report: File Size Report: File Type Report: Directory Report: Redirection Report: Failure Report: Request Report)
This report lists the computers which were redirected to another file.
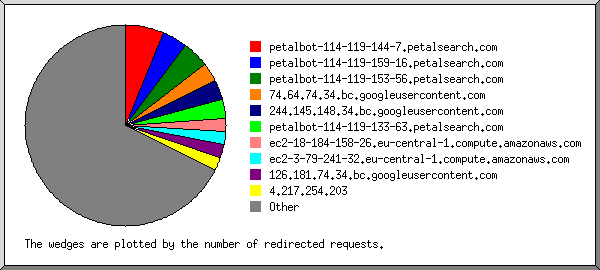
Listing the top 20 hosts by the number of redirected requests, sorted by the number of redirected requests.
#reqs: host
-----: ----
    9: petalbot-114-119-153-56.petalsearch.com
    6: petalbot-114-119-129-199.petalsearch.com
    5: petalbot-114-119-133-63.petalsearch.com
    5: petalbot-114-119-155-111.petalsearch.com
    3: petalbot-114-119-159-16.petalsearch.com
    3: petalbot-114-119-144-7.petalsearch.com
    2: petalbot-114-119-162-58.petalsearch.com
    2: petalbot-114-119-136-174.petalsearch.com
    1: proxy-ca012-san125.ahrefs.net
    1: 5-255-231-52.spider.yandex.com
    1: proxy-ca019-san85.ahrefs.net
    1: proxy-ca005-san176.ahrefs.net
    1: proxy-ca002-san217.ahrefs.net
    1: 197.221.149.82
    1: c247.ibou.io
    1: proxy-ca008-san240.ahrefs.net
    1: proxy-ca003-san72.ahrefs.net
    1: proxy-ca011-san162.ahrefs.net
    1: proxy-ca009-san65.ahrefs.net
    1: proxy-ca017-san130.ahrefs.net
   10: [not listed: 10 hosts]
(Go To: Top: General Summary: Weekly Report: Daily Report: Daily Summary: Hour of the Week Summary: Hourly Summary: Domain Report: Organization Report: Host Report: Host Redirection Report: Host Failure Report: Redirected Referrer Report: Failed Referrer Report: Referrer Report: Referring Site Report: Browser Report: Browser Summary: Operating System Report: Status Code Report: File Size Report: File Type Report: Directory Report: Redirection Report: Failure Report: Request Report)
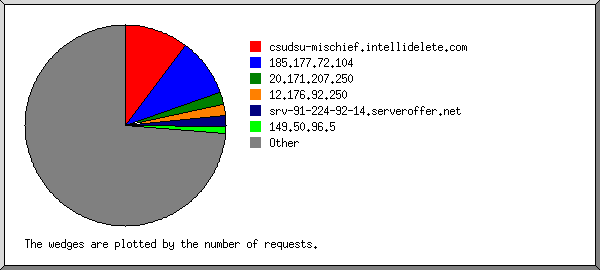
This report lists the computers which encountered failed requests.
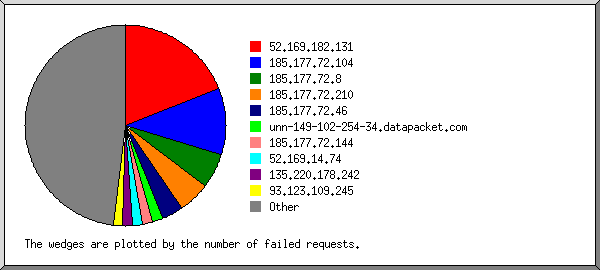
Listing the top 20 hosts by the number of failed requests, sorted by the number of failed requests.
#reqs: host
-----: ----
 1612: 185.177.72.13
 1612: 185.177.72.56
 1608: 185.177.72.51
 1156: 185.177.72.38
 1008: 195.178.110.108
  756: 195.178.110.199
  537: 4.190.203.84
  459: 74.225.193.147
  432: 74.176.59.137
  411: 139-144-52-241.ip.linodeusercontent.com
  404: 185.177.72.30
  399: 4.218.10.48
  398: 4.230.44.177
  323: 45.148.10.143
  320: 78.153.140.224
  299: 74.176.56.30
  285: 45.148.10.247
  283: 52.141.42.203
  281: 78.153.140.151
  275: 78.153.140.203
14497: [not listed: 1,407 hosts]
(Go To: Top: General Summary: Weekly Report: Daily Report: Daily Summary: Hour of the Week Summary: Hourly Summary: Domain Report: Organization Report: Host Report: Host Redirection Report: Host Failure Report: Redirected Referrer Report: Failed Referrer Report: Referrer Report: Referring Site Report: Browser Report: Browser Summary: Operating System Report: Status Code Report: File Size Report: File Type Report: Directory Report: Redirection Report: Failure Report: Request Report)
This report lists the referrers that caused redirected requests.
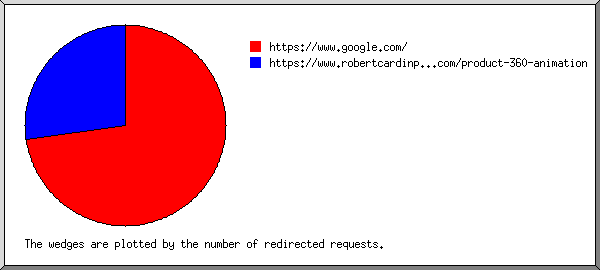
Listing referring URLs, sorted by the number of redirected requests.
#reqs: URL
-----: ---
    3: https://www.robertcardinphotography.com/product-360-animation
    1: https://www.yahoo.com/
    1: https://duckduckgo.com/
(Go To: Top: General Summary: Weekly Report: Daily Report: Daily Summary: Hour of the Week Summary: Hourly Summary: Domain Report: Organization Report: Host Report: Host Redirection Report: Host Failure Report: Redirected Referrer Report: Failed Referrer Report: Referrer Report: Referring Site Report: Browser Report: Browser Summary: Operating System Report: Status Code Report: File Size Report: File Type Report: Directory Report: Redirection Report: Failure Report: Request Report)
This report lists the referrers containing broken links to the site.
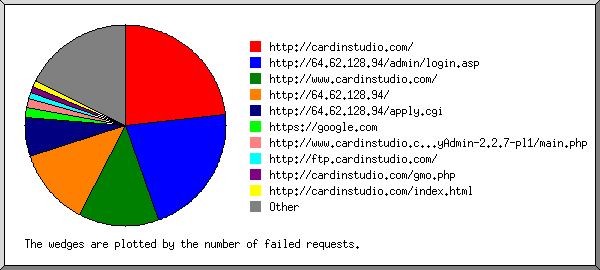
Listing referring URLs, sorted by the number of failed requests.
#reqs: URL
-----: ---
 1105: https://www.yahoo.com/
 1089: https://www.google.fr/
 1051: https://duckduckgo.com/
 1022: https://www.google.co.uk/
 1012: https://www.google.de/
 1010: https://www.google.com/
 1010: https://www.bing.com/
   40: http://cardinstudio.com/
   32: http://64.62.128.94/
   31: http://64.62.128.94/home.asp
   16: http://www.cardinstudio.com/
    7: http://64.62.128.94/admin/login.asp
    4: http://www.cardinstudio.com/nexus360/
    2: http://ftp.cardinstudio.com/
    2: http://cardinstudio.com/index.html
    2: http://cardinstudio.com/site05/detecting_flash.html
    2: https://www.redtailwoodworks.net/about
    2: http://www.cardinstudio.com/nexus360/data/css/main.min.css
    2: http://mail.cardinstudio.com/
    1: http://cardinstudio.com/vx.php
    1: http://cardinstudio.com/1a.php
    1: http://cardinstudio.com/m44.php
    1: http://cardinstudio.com/403.php
    1: http://cardinstudio.com/404.php
    1: http://cardinstudio.com/doo.php
    1: http://cardinstudio.com/ss.php
    1: http://cardinstudio.com/g.php
    1: http://cardinstudio.com/m.php
    1: http://cardinstudio.com/dddd.php
    1: http://cardinstudio.com/b1.php
    1: http://cardinstudio.com/x.php
    1: http://64.62.128.94/advance/traceroute.html
    1: http://cardinstudio.com/dds.php
    1: http://cardinstudio.com/edit-css.php
    1: http://cardinstudio.com/xx.php
    1: http://cardinstudio.com/webix.php
    1: http://www.cardinstudio.com/samsung4s/data/js/jquery-1.4.4.min.js
    1: http://cardinstudio.com/byp.php
    1: http://cardinstudio.com/info.php
    1: http://cardinstudio.com/2.php
    1: http://cardinstudio.com/safari.php
    1: http://cardinstudio.com/about.php
    1: http://cardinstudio.com/ola.php
    1: http://cardinstudio.com/ca.php
    1: http://64.62.128.94/site05/detecting_flash.html
(Go To: Top: General Summary: Weekly Report: Daily Report: Daily Summary: Hour of the Week Summary: Hourly Summary: Domain Report: Organization Report: Host Report: Host Redirection Report: Host Failure Report: Redirected Referrer Report: Failed Referrer Report: Referrer Report: Referring Site Report: Browser Report: Browser Summary: Operating System Report: Status Code Report: File Size Report: File Type Report: Directory Report: Redirection Report: Failure Report: Request Report)
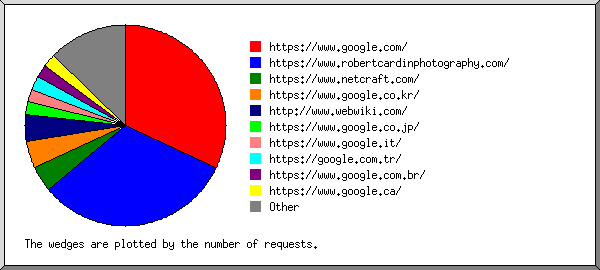
This report lists the referrers (where people followed links from, or pages which included this site's images).
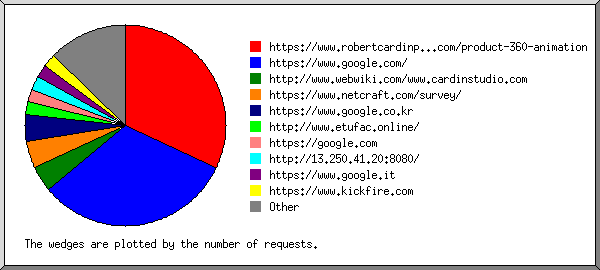
Listing referring URLs, sorted by the number of requests.
#reqs: URL
-----: ---
   14: https://www.robertcardinphotography.com/product-360-animation
    4: https://robert-cardin-ykgu.squarespace.com
    3: https://www.google.co.uk/
    2: http://64.62.128.94/
    2: https://duckduckgo.com/
    2: https://www.redtailwoodworks.net/about
    2: https://www.google.de/
    1: http://64.62.128.94/cgi-bin/index2.asp
    1: https://www.google.fr/
    1: https://www.yahoo.com/
    1: http://64.62.128.94/left.html
    1: https://www.quora.com/
    1: https://www.google.com/
    1: https://www.bing.com/
    1: http://www.redtailwoodworks.net/
    1: http://rots.depcysblog.online/
(Go To: Top: General Summary: Weekly Report: Daily Report: Daily Summary: Hour of the Week Summary: Hourly Summary: Domain Report: Organization Report: Host Report: Host Redirection Report: Host Failure Report: Redirected Referrer Report: Failed Referrer Report: Referrer Report: Referring Site Report: Browser Report: Browser Summary: Operating System Report: Status Code Report: File Size Report: File Type Report: Directory Report: Redirection Report: Failure Report: Request Report)
This report lists which servers people followed links from.
Listing referring sites, sorted by the number of requests.
#reqs: site
-----: ----
   14: https://www.robertcardinphotography.com/
    4: https://robert-cardin-ykgu.squarespace.com/
    4: http://64.62.128.94/
    3: https://www.google.co.uk/
    2: https://www.redtailwoodworks.net/
    2: https://www.google.de/
    2: https://duckduckgo.com/
    1: https://www.google.fr/
    1: https://www.google.com/
    1: https://www.yahoo.com/
    1: https://www.bing.com/
    1: http://rots.depcysblog.online/
    1: https://www.quora.com/
    1: http://www.redtailwoodworks.net/
(Go To: Top: General Summary: Weekly Report: Daily Report: Daily Summary: Hour of the Week Summary: Hourly Summary: Domain Report: Organization Report: Host Report: Host Redirection Report: Host Failure Report: Redirected Referrer Report: Failed Referrer Report: Referrer Report: Referring Site Report: Browser Report: Browser Summary: Operating System Report: Status Code Report: File Size Report: File Type Report: Directory Report: Redirection Report: Failure Report: Request Report)
This report lists the browsers used by visitors.
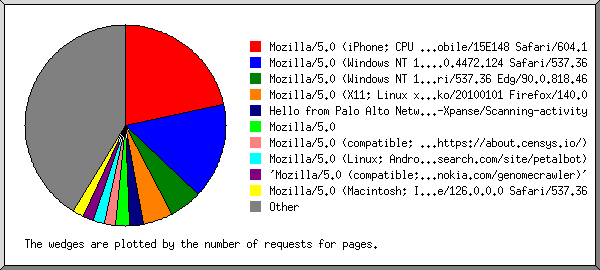
Listing the top 40 browsers by the number of requests for pages, sorted by the number of requests for pages.
#reqs: #pages: browser
-----: ------: -------
  586:    586: Mozilla/5.0 (iPhone; CPU iPhone OS 13_2_3 like Mac OS X) AppleWebKit/605.1.15 (KHTML, like Gecko) Version/13.0.3 Mobile/15E148 Safari/604.1
  252:    252: Mozilla/5.0
  217:    217: socketburst/0.1
  229:    155: Mozilla/5.0 (Linux; Android 7.0;) AppleWebKit/537.36 (KHTML, like Gecko) Mobile Safari/537.36 (compatible; PetalBot;+https://webmaster.petalsearch.com/site/petalbot)
  624:    140: Mozilla/5.0 (compatible; AhrefsBot/7.0; +http://ahrefs.com/robot/)
  114:    113: Mozilla/5.0 (compatible; MJ12bot/v1.4.8; http://mj12bot.com/)
   69:     69: Hello from Palo Alto Networks, find out more about our scans in https://docs-cortex.paloaltonetworks.com/r/1/Cortex-Xpanse/Scanning-activity
   57:     57: Mozilla/5.0 (compatible; CensysInspect/1.1; +https://about.censys.io/)
   56:     56: Mozilla/5.0 zgrab/0.x
   53:     53: Mozilla/5.0 (Windows NT 10.0; Win64; x64) AppleWebKit/537.36 (KHTML, like Gecko) Chrome/60.0.3112.113 Safari/537.36
   50:     50: Go-http-client/1.1
   45:     45: cypex.ai/scanning Mozilla/5.0 (Macintosh; Intel Mac OS X 10_15_7) Chrome/126.0.0.0 Safari/537.36
   44:     44: Mozilla/5.0 (Windows NT 10.0; Win64; x64) AppleWebKit/537.36 (KHTML, like Gecko) Chrome/78.0.3904.108 Safari/537.36
   43:     43: python-requests/2.32.5
   39:     39: Mozilla/5.0 (compatible; MJ12bot/v2.0.4; http://mj12bot.com/)
   39:     39: 'Mozilla/5.0 (compatible; GenomeCrawlerd/1.0; +https://www.nokia.com/genomecrawler)'
   35:     35: Mozilla/1.0
   35:     35: Mozilla/5.0 (Windows NT 10.0; Win64; x64) AppleWebKit/537.36 (KHTML, like Gecko) Chrome/136.0.0.0 Safari/537.36
   35:     35: Mozilla/5.0 (Windows NT 10.0; Win64; x64; rv:143.0) Gecko/20100101 Firefox/143.0
   31:     31: Mozilla/5.0 (Windows NT 6.1; Win64; x64; rv:47.0) Gecko/20100101 Firefox/47.0
   31:     31: python-requests/2.31.0
   30:     27: curl/7.54.0
   27:     27: Mozilla/5.0 (Windows NT 10.0; Win64; x64) AppleWebKit/537.36 (KHTML, like Gecko) Chrome/90.0.4430.85 Safari/537.36 Edg/90.0.818.46
   26:     26: Mozilla/5.0 AppleWebKit/537.36 (KHTML, like Gecko; compatible; Amazonbot/0.1; +https://developer.amazon.com/support/amazonbot) Chrome/119.0.6045.214 Safari/537.36
   25:     25: curl/8.7.1
   22:     22: Mozilla/5.0 (X11; Linux x86_64; rv:140.0) Gecko/20100101 Firefox/140.0
   21:     21: Mozilla/5.0 (Windows NT 10.0; Win64; x64) AppleWebKit/537.36 (KHTML, like Gecko) Chrome/140.0.0.0 Safari/537.36
   20:     20: Mozilla/5.0 (compatible; SERankingBacklinksBot/1.0; +https://seranking.com/backlinks-crawler)
   18:     18: Mozilla/5.0 (Windows NT 10.0; Win64; x64) AppleWebKit/537.36 (KHTML, like Gecko) Chrome/108.0.0.0 Safari/537.36
   17:     17: Mozilla/5.0 (X11; Linux x86_64) AppleWebKit/537.36 (KHTML, like Gecko) Chrome/142.0.0.0 Safari/537.36
   17:     17: Mozilla/5.0 (Windows NT 10.0; WOW64) AppleWebKit/537.36 (KHTML, like Gecko) Chrome/51.0.2704.103 Safari/537.36
  138:     16: Mozilla/5.0 (Macintosh; Intel Mac OS X 10_15_7) AppleWebKit/537.36 (KHTML, like Gecko) Chrome/142.0.0.0 Safari/537.36
   16:     16: Mozilla/5.0 (Windows NT 6.1) AppleWebKit/537.36 (KHTML, like Gecko) Chrome/49.0.2623.112 Safari/537.36
   16:     16: Mozilla/5.0 (Windows NT 6.1) AppleWebKit/537.36 (KHTML, like Gecko) Chrome/41.0.2228.0 Safari/537.36
   16:     16: Mozilla/5.0 (X11; Linux x86_64; rv:142.0) Gecko/20100101 Firefox/142.0
   14:     14: Mozilla/5.0 (Windows NT 10.0; Win64; x64) AppleWebKit/537.36 (KHTML, like Gecko) Chrome/125.0.0.0 Safari/537.36
   14:     14: Mozilla/5.0 (Windows NT 10.0; WOW64) AppleWebKit/537.36 (KHTML, like Gecko) Chrome/52.0.2743.116 Safari/537.36
   14:     14: Mozilla/5.0 (Macintosh; Intel Mac OS X 10_11_6) AppleWebKit/601.7.7 (KHTML, like Gecko) Version/9.1.2 Safari/601.7.7
   13:     13: Mozilla/5.0 (Linux; Android 6.0.1; Nexus 5X Build/MMB29P) AppleWebKit/537.36 (KHTML, like Gecko) Chrome/143.0.7499.192 Mobile Safari/537.36 (compatible; Googlebot/2.1; +http://www.google.com/bot.html)
   12:     12: Mozilla/5.0 (compatible; InternetMeasurement/1.0; +https://internet-measurement.com/)
 1516:    803: [not listed: 429 browsers]
(Go To: Top: General Summary: Weekly Report: Daily Report: Daily Summary: Hour of the Week Summary: Hourly Summary: Domain Report: Organization Report: Host Report: Host Redirection Report: Host Failure Report: Redirected Referrer Report: Failed Referrer Report: Referrer Report: Referring Site Report: Browser Report: Browser Summary: Operating System Report: Status Code Report: File Size Report: File Type Report: Directory Report: Redirection Report: Failure Report: Request Report)
This report lists the vendors of visitors' browsers.
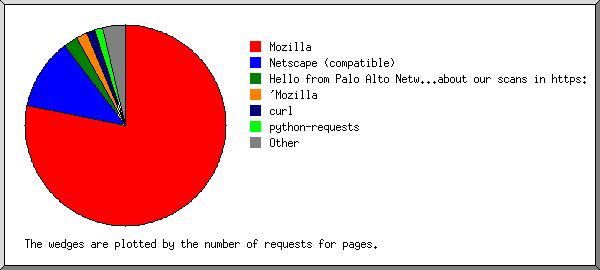
Listing the top 20 browsers by the number of requests for pages, sorted by the number of requests for pages.
 #: #reqs: #pages: browser
--: -----: ------: -------
 1:  2730:   1916: Mozilla
  :    35:     35:   Mozilla/143
  :    31:     31:   Mozilla/47
  :    23:     23:   Mozilla/140
  :    17:     17:   Mozilla/142
  :    14:     14:   Mozilla/109
  :    11:     11:   Mozilla/134
  :     6:      6:   Mozilla/123
  :     6:      6:   Mozilla/144
  :     5:      5:   Mozilla/125
  :     5:      5:   Mozilla/8
 2:  1267:    689: Netscape (compatible)
 3:   217:    217: socketburst
  :   217:    217:   socketburst/0
 4:    75:     75: python-requests
  :    75:     75:   python-requests/2
 5:    75:     72: curl
  :    47:     44:   curl/7
  :    26:     26:   curl/8
 6:    69:     69: Hello from Palo Alto Networks, find out more about our scans in https:
  :    69:     69:   Hello from Palo Alto Networks, find out more about our scans in https://docs-cortex
 7:    50:     50: Go-http-client
  :    50:     50:   Go-http-client/1
 8:    45:     45: cypex.ai
  :    45:     45:   cypex.ai/scanning
 9:    39:     39: 'Mozilla
  :    39:     39:   'Mozilla/5
10:    35:     35: Netscape
  :    35:     35:   Netscape/1
11:     7:      7: ZoominfoBot (zoominfobot at zoominfo dot com)
12:     8:      7: Opera
  :     6:      5:   Opera/9
  :     1:      1:   Opera/8
  :     1:      1:   Opera/7
13:     6:      6: Wget
14:     6:      6: Linux Gnu (cow)
15:     7:      6: MSIE
  :     2:      2:   MSIE/7
  :     1:      1:   MSIE/9
  :     1:      1:   MSIE/4
  :     1:      1:   MSIE/5
  :     2:      1:   MSIE/6
16:     5:      5: 8LEGS
17:     5:      5: masscan
  :     5:      5:   masscan/1
18:     4:      4: Hello World
19:     4:      4: HTTP Banner Detection (https:
  :     4:      4:   HTTP Banner Detection (https://security
20:     2:      2: DomainStatsBot
  :     2:      2:   DomainStatsBot/1
  :    20:     20: [not listed: 18 browsers]
(Go To: Top: General Summary: Weekly Report: Daily Report: Daily Summary: Hour of the Week Summary: Hourly Summary: Domain Report: Organization Report: Host Report: Host Redirection Report: Host Failure Report: Redirected Referrer Report: Failed Referrer Report: Referrer Report: Referring Site Report: Browser Report: Browser Summary: Operating System Report: Status Code Report: File Size Report: File Type Report: Directory Report: Redirection Report: Failure Report: Request Report)
This report lists the operating systems used by visitors.
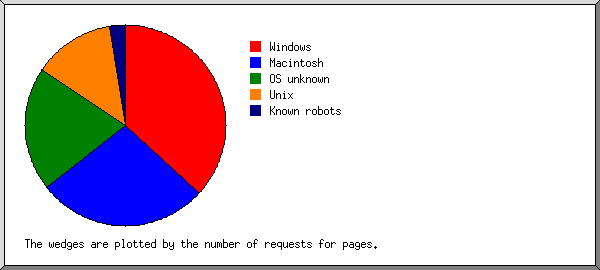
Listing operating systems, sorted by the number of requests for pages.
 #: #reqs: #pages: OS
--: -----: ------: --
 1:  1248:   1225: OS unknown
 2:  1172:    827: Macintosh
  :  1170:    825:   Unknown Macintosh
  :     2:      2:   Macintosh 68k
 3:   684:    636: Windows
  :   551:    505:   Windows NT
  :   124:    123:   Unknown Windows
  :     7:      7:   Windows XP
  :     1:      1:   Windows CE
  :     1:      0:   Windows 2000
 4:   872:    375: Unix
  :   865:    368:   Linux
  :     5:      5:   Other Unix
  :     2:      2:   BSD
 5:   697:    213: Known robots
 6:     3:      3: OS/2
(Go To: Top: General Summary: Weekly Report: Daily Report: Daily Summary: Hour of the Week Summary: Hourly Summary: Domain Report: Organization Report: Host Report: Host Redirection Report: Host Failure Report: Redirected Referrer Report: Failed Referrer Report: Referrer Report: Referring Site Report: Browser Report: Browser Summary: Operating System Report: Status Code Report: File Size Report: File Type Report: Directory Report: Redirection Report: Failure Report: Request Report)
This report lists the HTTP status codes of all requests.
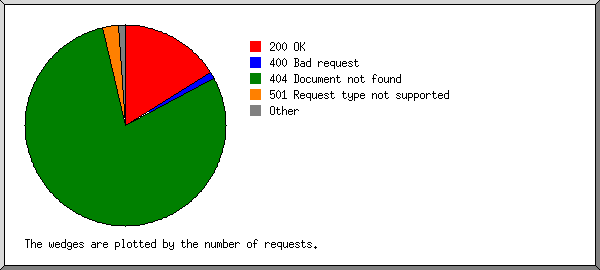
Listing status codes, sorted numerically.
#reqs: status code
-----: -----------
 5061: 200 OK
    6: 206 Partial content
   36: 301 Document moved permanently
   21: 302 Document found elsewhere
   12: 304 Not modified since last retrieval
  265: 400 Bad request
   36: 403 Access forbidden
25807: 404 Document not found
  489: 405 Method not allowed
    8: 408 Request timeout
  750: 501 Request type not supported
(Go To: Top: General Summary: Weekly Report: Daily Report: Daily Summary: Hour of the Week Summary: Hourly Summary: Domain Report: Organization Report: Host Report: Host Redirection Report: Host Failure Report: Redirected Referrer Report: Failed Referrer Report: Referrer Report: Referring Site Report: Browser Report: Browser Summary: Operating System Report: Status Code Report: File Size Report: File Type Report: Directory Report: Redirection Report: Failure Report: Request Report)
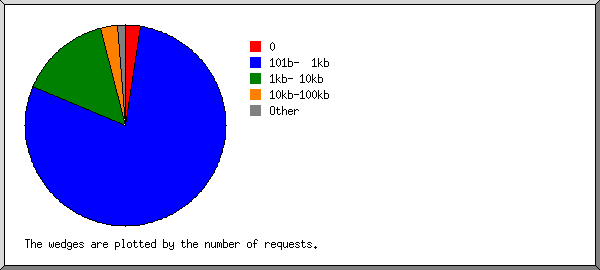
This report lists the sizes of files.
       size: #reqs: %bytes:
-----------: -----: ------:
          0:    86:       :
   1b-  10b:     2:       :
  11b- 100b:     3:       :
 101b-  1kb:  3382:  0.73%:
  1kb- 10kb:  1221:  1.41%:
 10kb-100kb:   324:  9.06%:
100kb-  1Mb:    43:  2.76%:
  1Mb- 10Mb:     6: 18.73%:
 10Mb-100Mb:    12: 67.30%:
(Go To: Top: General Summary: Weekly Report: Daily Report: Daily Summary: Hour of the Week Summary: Hourly Summary: Domain Report: Organization Report: Host Report: Host Redirection Report: Host Failure Report: Redirected Referrer Report: Failed Referrer Report: Referrer Report: Referring Site Report: Browser Report: Browser Summary: Operating System Report: Status Code Report: File Size Report: File Type Report: Directory Report: Redirection Report: Failure Report: Request Report)
This report lists the extensions of requested files.
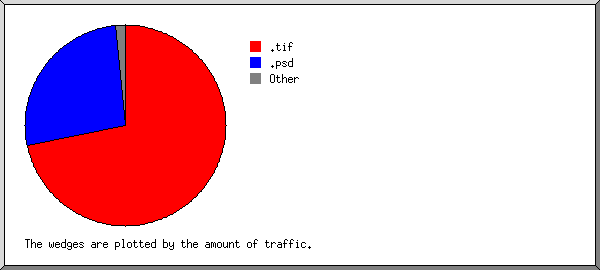
Listing extensions with at least 0.1% of the traffic, sorted by the amount of traffic.
#reqs:  Mbytes: %bytes: extension
-----: -------: ------: ---------
   16: 150.582: 72.06%: .tif
    3:  30.139: 14.42%: .psd
  312:  20.543:  9.83%: .jpg  [JPEG graphics]
 3508:   2.226:  1.07%: [directories]
  936:   1.773:  0.85%: .php  [PHP]
   49:   1.378:  0.66%: .js   [JavaScript code]
  174:   1.269:  0.61%: .html [Hypertext Markup Language]
    3:   0.749:  0.36%: .pdf  [Adobe Portable Document Format]
   78:   0.313:  0.15%: [not listed: 5 extensions]
(Go To: Top: General Summary: Weekly Report: Daily Report: Daily Summary: Hour of the Week Summary: Hourly Summary: Domain Report: Organization Report: Host Report: Host Redirection Report: Host Failure Report: Redirected Referrer Report: Failed Referrer Report: Referrer Report: Referring Site Report: Browser Report: Browser Summary: Operating System Report: Status Code Report: File Size Report: File Type Report: Directory Report: Redirection Report: Failure Report: Request Report)
This report lists the directories from which files were requested. (The figures for each directory include all of its subdirectories.)

Listing directories with at least 1 byte of traffic, sorted by the amount of traffic.
#reqs:  Mbytes: %bytes: directory
-----: -------: ------: ---------
  209: 181.331: 86.77%: /clients/
   15: 143.708: 68.77%:   /clients/testprint/
  137:   9.273:  4.44%: /eka360animated/
  120:   9.227:  4.42%:   /eka360animated/data/
  232:   7.879:  3.77%: /nexus360/
  205:   7.842:  3.75%:   /nexus360/data/
  977:   2.655:  1.27%: /phpMyAdmin-2.2.7-pl1/
   47:   2.427:  1.16%: /delllaptop360/
   38:   2.401:  1.15%:   /delllaptop360/data/
   58:   2.346:  1.12%: /albert360animated/
   42:   2.301:  1.10%:   /albert360animated/data/
 3238:   1.373:  0.66%: [root directory]
    2:   0.626:  0.30%: /resume/
    4:   0.403:  0.19%: /Stats/
   50:   0.196:  0.09%: /images/
   10:   0.135:  0.06%: http://
    9:   0.104:  0.05%: /samsung4s/
    1:   0.033:  0.02%: /JPEG/
   12:   0.031:  0.01%: /lenovodesktop/
   19:   0.026:  0.01%: /toshibaallinone/
    9:   0.025:  0.01%: /hpprinteranimated/
    8:   0.022:  0.01%: /chromebook360/
    8:   0.022:  0.01%: /asuswifi/
    7:   0.019:  0.01%: /macbook13360/
    7:   0.019:  0.01%: /lenovoyoga360/
    4:   0.011:  0.01%: /vizioallinone/
   26:   0.009:       : /old/
    3:   0.001:       : /pages/
    2:   0.000:       : /site05/
(Go To: Top: General Summary: Weekly Report: Daily Report: Daily Summary: Hour of the Week Summary: Hourly Summary: Domain Report: Organization Report: Host Report: Host Redirection Report: Host Failure Report: Redirected Referrer Report: Failed Referrer Report: Referrer Report: Referring Site Report: Browser Report: Browser Summary: Operating System Report: Status Code Report: File Size Report: File Type Report: Directory Report: Redirection Report: Failure Report: Request Report)
This report lists the files that caused requests to be redirected to another file. (Usually directories with the final slash missing, or CGI scripts that forced redirections.)
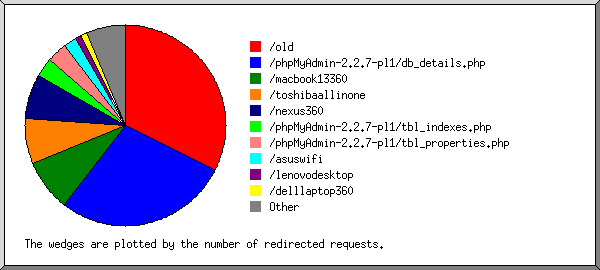
Listing files, sorted by the number of redirected requests.
#reqs: file
-----: ----
   15: /phpMyAdmin-2.2.7-pl1/db_details.php
    7: /macbook13360
    6: /clients/142tenthstx2
    5: /clients/142tenthstx4
    5: /clients/142tenthst
    4: /phpMyAdmin-2.2.7-pl1/tbl_properties.php
    4: /clients/142tenthstx3
    3: /toshibaallinone
    3: /nexus360
    2: /phpMyAdmin-2.2.7-pl1/tbl_indexes.php
    2: /images
    1: /old
(Go To: Top: General Summary: Weekly Report: Daily Report: Daily Summary: Hour of the Week Summary: Hourly Summary: Domain Report: Organization Report: Host Report: Host Redirection Report: Host Failure Report: Redirected Referrer Report: Failed Referrer Report: Referrer Report: Referring Site Report: Browser Report: Browser Summary: Operating System Report: Status Code Report: File Size Report: File Type Report: Directory Report: Redirection Report: Failure Report: Request Report)
This report lists the files that caused failures, for example files not found.
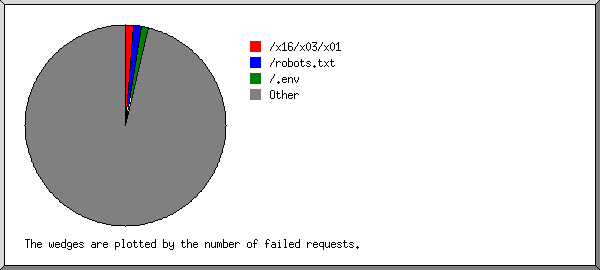
Listing the top 30 files by the number of failed requests, sorted by the number of failed requests.
#reqs: file
-----: ----
  446: /robots.txt
  385: /x16/x03/x01
  380: /
   60:   /?%ADd+allow_url_include%3d1+%ADd+auto_prepend_file%3dphp://input
  257: /favicon.ico
  202: /index.php
   49:   /index.php?lang=../../../../../../../../tmp/index1
   49:   /index.php?s=/index/\\think\\app/invokefunction&function=call_user_func_array&vars[0]=md5&vars[1][]=Hello
   49:   /index.php?lang=../../../../../../../../usr/local/lib/php/pearcmd&+config-create+/&/<?echo(md5(\"hi\"));?>+/tmp/index1.php
  191: /.env
  144: /SDK/webLanguage
  132: /info.php
  128: /site05/detecting_flash.html
  116: /.git/config
   93: /admin.php
   84: /vendor/phpunit/phpunit/src/Util/PHP/eval-stdin.php
   80: /adminfuns.php
   79: /file.php
   78: /ioxi-o.php
   74: /wp-good.php
   74: /abcd.php
   71: /classwithtostring.php
   71: /about.php
   68: /bin/sh
   68: /phpinfo.php
   63: /cgi-bin/%2ee2e/e2ee2e/e2ee2e/e2ee2e/e2ee2e/e2ee2e/e2ee2e/bin/sh
   62: /x16/x03/x02/x01o/x01
   62: /wp-includes/ID3/
   61: /hello.world
   61:   /hello.world?%ADd+allow_url_include%3d1+%ADd+auto_prepend_file%3dphp://input
   59: /akcc.php
   59: /wp-content/uploads/
   59: /login
   59: /bless.php
   59: /edit.php
23582: [not listed: 5,750 files]
(Go To: Top: General Summary: Weekly Report: Daily Report: Daily Summary: Hour of the Week Summary: Hourly Summary: Domain Report: Organization Report: Host Report: Host Redirection Report: Host Failure Report: Redirected Referrer Report: Failed Referrer Report: Referrer Report: Referring Site Report: Browser Report: Browser Summary: Operating System Report: Status Code Report: File Size Report: File Type Report: Directory Report: Redirection Report: Failure Report: Request Report)
This report lists the files on the site.
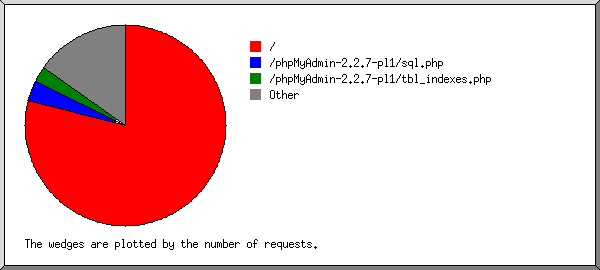
Listing the top 100 files by the number of requests, sorted by the number of requests.
#reqs:  Mbytes: %bytes:  %reqs: %pages: file
-----: -------: ------: ------: ------: ----
 3235:   1.372:  0.66%: 63.69%: 87.86%: /
  440:   0.868:  0.42%:  8.66%:       : /phpMyAdmin-2.2.7-pl1/tbl_qbe.php
  197:   0.223:  0.11%:  3.88%:       : /phpMyAdmin-2.2.7-pl1/sql.php
  133:   0.211:  0.10%:  2.62%:       : /phpMyAdmin-2.2.7-pl1/tbl_indexes.php
   45:   0.265:  0.13%:  0.89%:       : /phpMyAdmin-2.2.7-pl1/tbl_properties.php
   27:   0.037:  0.02%:  0.53%:  0.73%: /nexus360/
   27:   0.156:  0.07%:  0.53%:  0.73%: /images/
   26:   0.009:       :  0.51%:  0.71%: /old/
   20:   0.039:  0.02%:  0.39%:  0.54%: /images/nbar/
   19:   0.036:  0.02%:  0.37%:       : /phpMyAdmin-2.2.7-pl1/main.php
   19:   0.026:  0.01%:  0.37%:  0.52%: /toshibaallinone/
   17:   0.045:  0.02%:  0.33%:  0.46%: /eka360animated/
   16:   0.048:  0.02%:  0.32%:       : /phpMyAdmin-2.2.7-pl1/db_details.php
   16:   0.045:  0.02%:  0.32%:  0.43%: /albert360animated/
   14:   0.020:  0.01%:  0.28%:       : /phpMyAdmin-2.2.7-pl1/tbl_alter.php
   12:   0.059:  0.03%:  0.24%:  0.33%: /clients/142tenthst/
   12:   0.092:  0.04%:  0.24%:  0.33%: /phpMyAdmin-2.2.7-pl1/translators.html
   12:   0.031:  0.01%:  0.24%:  0.33%: /lenovodesktop/
   11:   0.091:  0.04%:  0.22%:  0.30%: /clients/142tenthstx2/
   11:   0.054:  0.03%:  0.22%:  0.30%: /clients/142tenthstx3/
   11:   0.091:  0.04%:  0.22%:  0.30%: /clients/142tenthstx4/
    9:   0.123:  0.06%:  0.18%:       : /nexus360/data/originals/turn01.jpg
    9:   0.490:  0.23%:  0.18%:       : /nexus360/data/originals/turn12.jpg
    9:   0.008:       :  0.18%:       : /phpMyAdmin-2.2.7-pl1/db_printview.php
    9:   0.025:  0.01%:  0.18%:  0.24%: /hpprinteranimated/
    9:   0.708:  0.34%:  0.18%:       : /nexus360/data/originals/turn05.jpg
    9:   0.288:  0.14%:  0.18%:       : /nexus360/data/originals/turn16.jpg
    9:   0.121:  0.06%:  0.18%:       : /nexus360/data/originals/turn09.jpg
    9:   0.401:  0.19%:  0.18%:       : /nexus360/data/originals/turn11.jpg
    9:   0.694:  0.33%:  0.18%:       : /nexus360/data/originals/turn04.jpg
    9:   0.580:  0.28%:  0.18%:  0.24%: /phpMyAdmin-2.2.7-pl1/Documentation.html
    9:   0.403:  0.19%:  0.18%:       : /nexus360/data/originals/turn15.jpg
    9:   0.419:  0.20%:  0.18%:       : /nexus360/data/originals/turn08.jpg
    9:   0.007:       :  0.18%:  0.24%: /clients/142tenthst/pages/office horz__.html
    9:   0.267:  0.13%:  0.18%:       : /nexus360/data/originals/turn10.jpg
    9:   0.590:  0.28%:  0.18%:       : /nexus360/data/originals/turn03.jpg
    9:   0.447:  0.21%:  0.18%:       : /nexus360/data/originals/turn14.jpg
    9:   0.025:  0.01%:  0.18%:  0.24%: /delllaptop360/
    9:   0.587:  0.28%:  0.18%:       : /nexus360/data/originals/turn07.jpg
    9:   0.007:       :  0.18%:  0.24%: /clients/142tenthst/pages/glass bar.html
    9:   0.405:  0.19%:  0.18%:       : /nexus360/data/originals/turn02.jpg
    9:   0.448:  0.21%:  0.18%:       : /nexus360/data/originals/turn13.jpg
    9:   0.718:  0.34%:  0.18%:       : /nexus360/data/originals/turn06.jpg
    8:   0.013:  0.01%:  0.16%:       : /phpMyAdmin-2.2.7-pl1/tbl_change.php
    8:   0.022:  0.01%:  0.16%:  0.22%: /chromebook360/
    8:   0.022:  0.01%:  0.16%:  0.22%: /asuswifi/
    8:   0.006:       :  0.16%:  0.22%: /clients/142tenthst/pages/kitch __.html
    7:   0.005:       :  0.14%:  0.19%: /clients/142tenthst/pages/bar vert __.html
    7:   0.019:  0.01%:  0.14%:  0.19%: /macbook13360/
    7:   0.099:  0.05%:  0.14%:       : /phpMyAdmin-2.2.7-pl1/LICENSE
    7:   0.005:       :  0.14%:  0.19%: /clients/142tenthst/pages/looking at st __.html
    7:   0.058:  0.03%:  0.14%:  0.19%: /clients/142tenthst/ThumbnailFrame.html
    7:   0.005:       :  0.14%:  0.19%: /clients/142tenthst/pages/_DSC0023_a.html
    7:   0.019:  0.01%:  0.14%:  0.19%: /lenovoyoga360/
    7:   0.005:       :  0.14%:  0.19%: /clients/142tenthst/pages/_DSC0058.html
    6:   0.435:  0.21%:  0.12%:       : /eka360animated/data/originals/turn01.jpg
    6:   0.551:  0.26%:  0.12%:       : /eka360animated/data/originals/turn12.jpg
    6:   0.623:  0.30%:  0.12%:       : /eka360animated/data/originals/turn05.jpg
    6:   0.474:  0.23%:  0.12%:       : /eka360animated/data/originals/turn16.jpg
    6:   0.620:  0.30%:  0.12%:       : /eka360animated/data/originals/turn09.jpg
    6:   0.004:       :  0.12%:  0.16%: /clients/142tenthstx3/pages/_DSC0023_a.html
    6:   0.645:  0.31%:  0.12%:       : /eka360animated/data/originals/turn11.jpg
    6:  62.452: 29.89%:  0.12%:       : /clients/testprint/_DSC1281_TEST_PRINT.tif
    6:   0.004:       :  0.12%:  0.16%: /clients/142tenthst/pages/_DSC0012.html
    6:   0.547:  0.26%:  0.12%:       : /eka360animated/data/originals/turn04.jpg
    6:   0.551:  0.26%:  0.12%:       : /eka360animated/data/originals/turn15.jpg
    6:   0.059:  0.03%:  0.12%:       : /phpMyAdmin-2.2.7-pl1/ChangeLog
    6:   0.515:  0.25%:  0.12%:       : /eka360animated/data/originals/turn08.jpg
    6:   0.004:       :  0.12%:  0.16%: /clients/142tenthst/pages/studio.html
    6:   0.603:  0.29%:  0.12%:       : /eka360animated/data/originals/turn10.jpg
    6:   0.015:  0.01%:  0.12%:       : /phpMyAdmin-2.2.7-pl1/README
    6:   0.543:  0.26%:  0.12%:       : /eka360animated/data/originals/turn03.jpg
    6:   0.004:       :  0.12%:  0.16%: /clients/142tenthst/pages/bath bar horz __.html
    6:   0.564:  0.27%:  0.12%:       : /eka360animated/data/originals/turn14.jpg
    6:   0.004:       :  0.12%:  0.16%: /clients/142tenthst/pages/_DSC0005_a.html
    6:   0.584:  0.28%:  0.12%:       : /eka360animated/data/originals/turn07.jpg
    6:   0.004:       :  0.12%:  0.16%: /clients/142tenthst/pages/_DSC0002_a.html
    6:   0.016:  0.01%:  0.12%:  0.16%: /samsung4s/
    6:   0.483:  0.23%:  0.12%:       : /eka360animated/data/originals/turn02.jpg
    6:   0.430:  0.21%:  0.12%:       : /eka360animated/data/originals/turn13.jpg
    6:   0.667:  0.32%:  0.12%:       : /eka360animated/data/originals/turn06.jpg
    6:  51.116: 24.46%:  0.12%:       : /clients/testprint/_DSC1279-HDR_Test_Print.tif
    5:   0.007:       :  0.10%:       : /phpMyAdmin-2.2.7-pl1/ldi_table.php
    5:   0.003:       :  0.10%:  0.14%: /clients/142tenthst/pages/_DSC0053.html
    5:   0.525:  0.25%:  0.10%:       : /nexus360/data/js/require-jquery.js
    5:   0.004:       :  0.10%:       : /nexus360/data/css/navigation.min.css
    5:   0.003:       :  0.10%:  0.14%: /clients/142tenthst/pages/_DSC0050.html
    5:   0.004:       :  0.10%:  0.14%: /clients/142tenthst/pages/_DSC0017_a.html
    5:   0.033:  0.02%:  0.10%:       : /nexus360/data/css/main.min.css
    5:   0.001:       :  0.10%:       : /nexus360/data/css/custom.min.css
    5:   0.009:       :  0.10%:       : /phpMyAdmin-2.2.7-pl1/read_dump.php
    5:   0.006:       :  0.10%:       : /phpMyAdmin-2.2.7-pl1/tbl_addfield.php
    5:   0.022:  0.01%:  0.10%:  0.14%: /clients/142tenthstx3/ThumbnailFrame.html
    5:   0.007:       :  0.10%:       : /nexus360/data/js/screenfull.min.js
    4:   0.021:  0.01%:  0.08%:       : /nexus360/data/images/loader.gif
    4:   0.299:  0.14%:  0.08%:       : /eka360animated/data/js/jquery-1.4.4.min.js
    4:   0.004:       :  0.08%:       : /nexus360/data/images/help.png
    4:   0.403:  0.19%:  0.08%:  0.11%: /Stats/thismonth.html
    4:   0.004:       :  0.08%:       : /nexus360/data/images/left.png
    4:   0.003:       :  0.08%:       : /phpMyAdmin-2.2.7-pl1/index.php
  227:  73.193: 35.02%:  4.47%:  1.14%: [not listed: 104 files]
(Go To: Top: General Summary: Weekly Report: Daily Report: Daily Summary: Hour of the Week Summary: Hourly Summary: Domain Report: Organization Report: Host Report: Host Redirection Report: Host Failure Report: Redirected Referrer Report: Failed Referrer Report: Referrer Report: Referring Site Report: Browser Report: Browser Summary: Operating System Report: Status Code Report: File Size Report: File Type Report: Directory Report: Redirection Report: Failure Report: Request Report)
